
Figures & data
Figure 1. Relative transcript level in T1 transgenic lines with modified expression MtGRAS7OE (A) and MtGRAS7RNAi (B) compared to WT plants. Data represent the mean values ± SEM (n = 3). Asterisks indicate statistically significant differences compared to the control: **p < 0.01; ***p < 0.001.
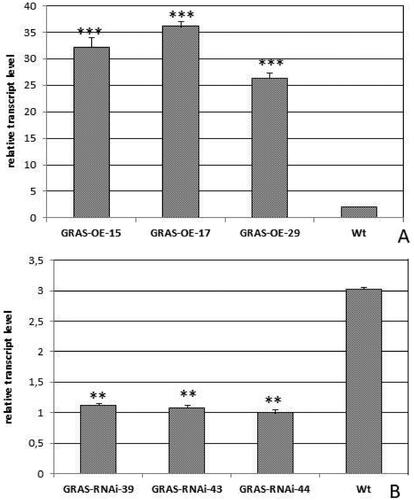
Figure 2. Phenotype comparison of T1 transgenic lines with modified expression MtGRAS7OE and MtGRAS7RNAi compared to WT plants. Shape of root in WT, GRAS-OE and GRAS-RNAi (A); distribution of nodules in WT, GRAS-OE and GRAS-RNAi (B); shape of flowers and pods in WT, GRAS-OE and GRAS-RNAi (C).
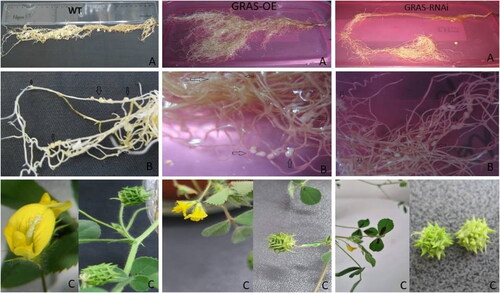
Figure 3. Plant architecture of T1 transgenic lines with modified expression MtGRAS7OE and MtGRAS7RNAi compared to WT plants.
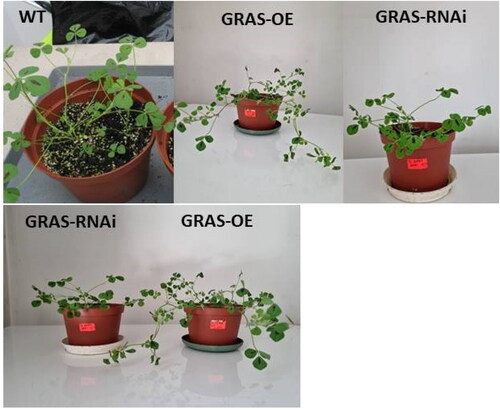
Figure 4. Relative transcript level of MtGRAS7 in T1 transgenic lines with modified expression of MtGRAS7OE and MtGRAS7RNAi compared to WT plants after stress induced by 350 mmol/L mannitol treatment for 0, 24, 48 and 72 h. Leaves (A); Nodules (B). Data represent the mean level of expression of three independent transgenic lines and three control plants ± SEM. *p < 0.05; **p < 0.01; ***p < 0.001.
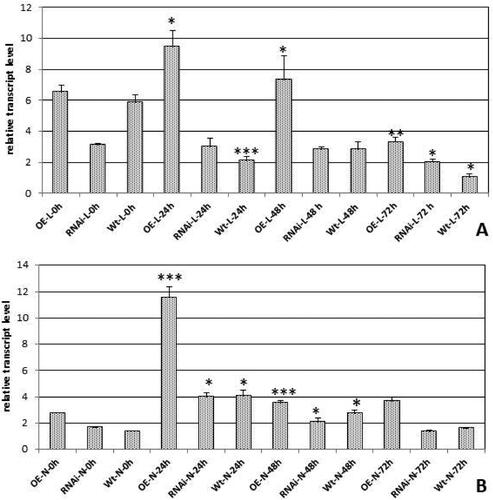
Figure 5. Relative transcript level of MtGRAS7 in T1 transgenic lines with modified expression MtGRAS7OE and MtGRAS7RNAi compared to WT plants after stress induced by 150 mmol/L NaCl treatment for 0, 24, 48 and 72 h. Leaves (A); Nodules (B). Data represent the mean level of expression of three independent transgenic lines and three control plants ± SEM. **p < 0.01; ***p < 0.001.
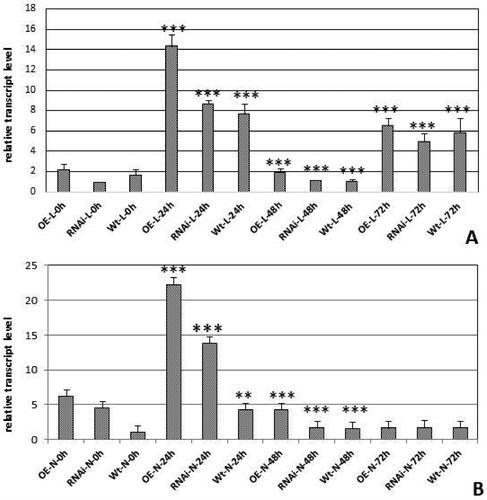
Figure 6. Seed production of MtGRAS7OE transgenic lines with modified expression and control 2HA-Wt after application of drought and salinity stress.
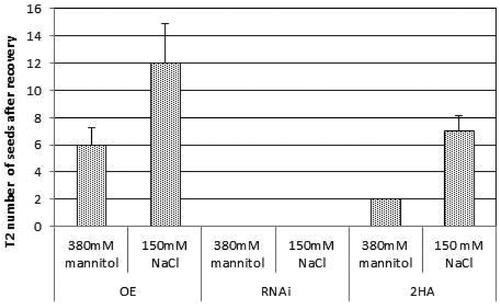
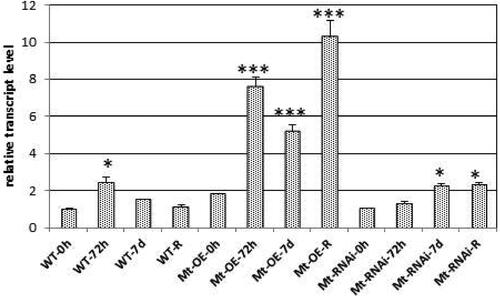
Figure 7. Relative transcript level of MtGRAS7 in T1 transgenic lines with modified expression MtGRAS7OE and MtGRAS7RNAi compared to WT plants after stress induced by cold (4 °C) for 0 h, 72 h and 7 days; R, recovery period of one week. Data represent the mean level of expression of three independent transgenic lines and three control plants ± SEM. *p < 0.05; ***p < 0.001.
Supplemental Material
Download PDF (665.9 KB)Data availability
All data that support the findings reported in this study are available from the corresponding author upon reasonable request.