
Figures & data
Figure 1. Phenotypic appearance of soybean plants under different treatments. (A) The phenotypes at 5 days after drought (DAD). (B) The phenotypes at 5 days after resupplying water (DRW). CK, water control; DS, drought stress; ACK, water control treated with AMEP412; ADS, drought stress pre-treated with AMEP412. Same below.
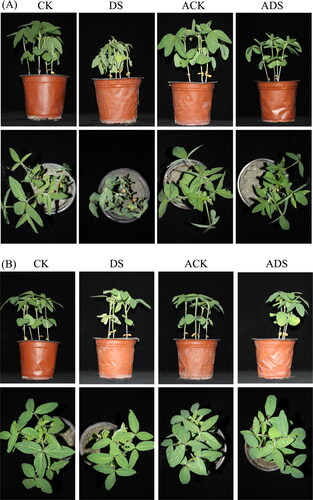
Figure 2. Alterations in the physiological indexes of different treatments throughout the experimental period. (A) RWC; (B) RC; (C) free proline; (D) soluble sugar; (E) soluble protein. Means denoted by the same letters did not differ significantly at p ≤ 0.05 according to Duncan’s multiple range test. Error bars show ± SEM. Same below.
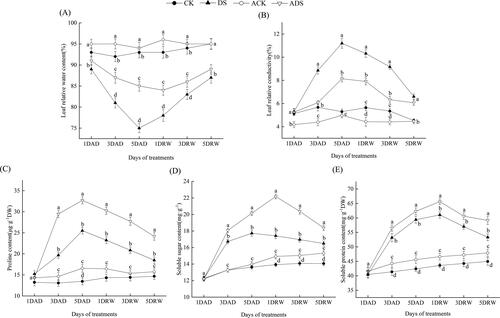
Figure 3. DAB and NBT staining to assess H2O2 (A) and O2 (B) production in soybean leaves in the different treatments.
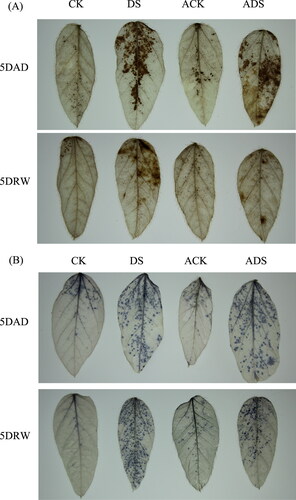
Figure 4. Alterations in the H2O2 (A) and O2 (B) of different treatments throughout the experimental period.
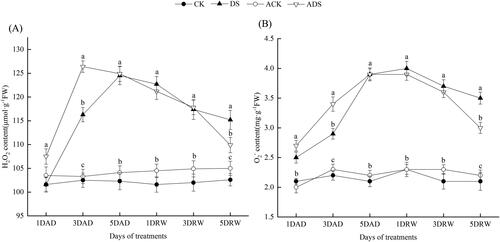
Figure 5. Alterations in the antioxidant enzyme activities of different treatments throughout the experimental period: (A) SOD; (B) POD; (C) CAT; (D)APX; (E) MDHAR; (F) DHAR; (G) GR; (H) GPX.
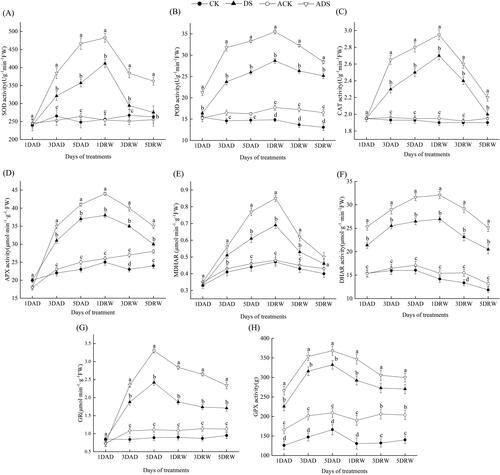
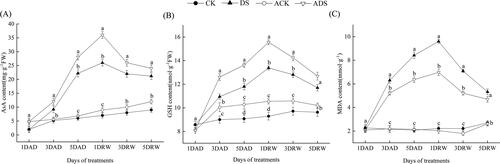
Figure 6. Alterations in the antioxidants and MDA of different treatments throughout the experimental period: (A) AsA; (B) GSH; (C) MDA.
Data availability statement
All data that support the findings of this study are available from the corresponding author upon reasonable request.