
Figures & data
Figure 1. Schematic diagram of carrier construction. Prokaryotic expression vector (a), subcellular localization vector (b), overexpression vector (c).
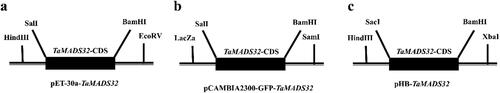
Table 1. Details of primers used in this study.
Figure 2. Chromosome location, gene structure phylogenetic analysis of the gene in different species. Gene map (a), gene structure (b), protein structure (c), phylogenetic analysis (d).
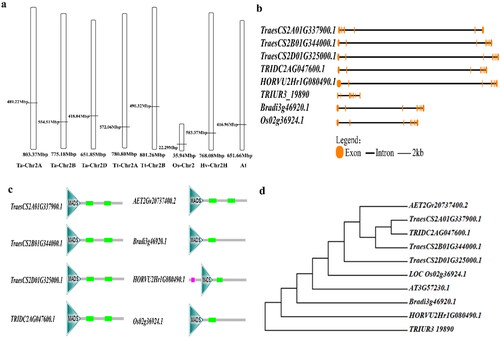
Table 2. Putative transcription factors of promoters in wheat, barley and rice.
Figure 3. Expression patterns of TaMADS32 in wheat. Gene expression pattern at different periods in the exp VIP database, Zadok’s wheat growth phases (a). The gene expression pattern in the Wheat exp database (b). RT-qPCR validation results from different tissues at different periods (c). Three biological replicates were used.
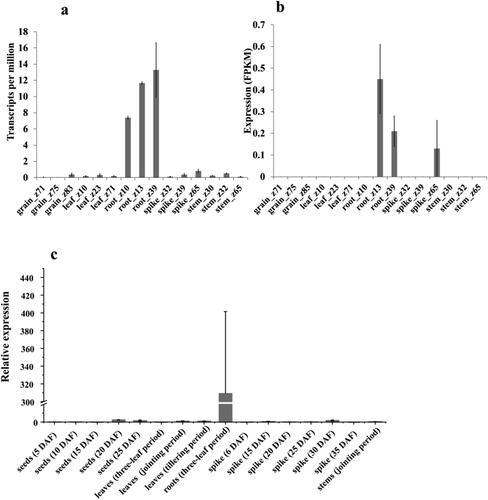
Figure 4. Expression patterns of the TaMADS32 gene under various abiotic stresses. Gene expression patterns under stresses (PEG, cold, drought and heat stresses) in the expVIP database, the seedlings of 9 days were treated with drought and three-leaf seedlings were treated with cold (a,b). RT-qPCR validation results; DAF, days after flowering (c). Three biological replicates. Note: * Significant at the 0.05 probability level, **Significant at the 0.01 probability level.
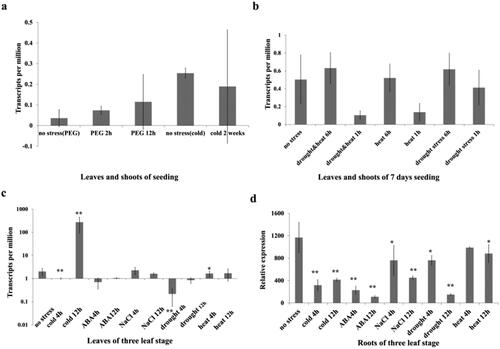
Figure 5. Prokaryotic expression analysis of TaMADS32 in E. coli BL21. The target band is marked by a red line. Lanes to the left of the marker: bacteria carrying the empty vector induced by IPTG, and lanes to the right of the marker: bacteria carrying recombinant vector induced by IPTG.
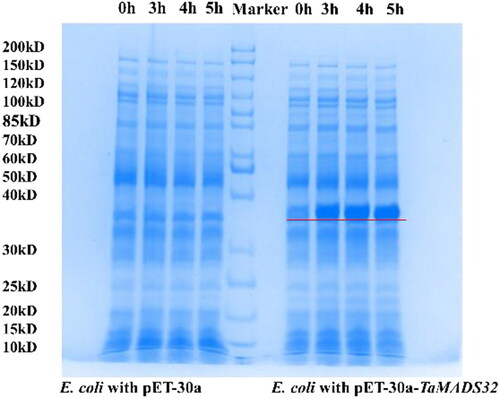
Figure 6. Subcellular localization of TaMADS32 protein in onion epidermal cells. The green fluorescence of PCAMBIA2300-GFP is distributed in the top panel (a,b) and PCAMBIA2300-GFP-TaMADS32 in the bottom panel (c,d). Red arrows indicate the locations where the green fluorescence is distributed.
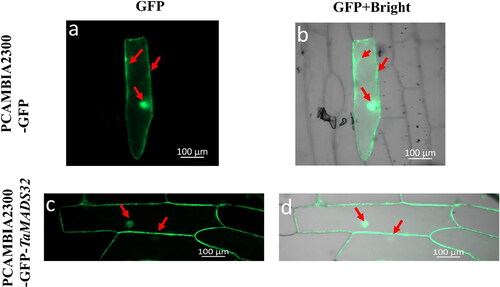
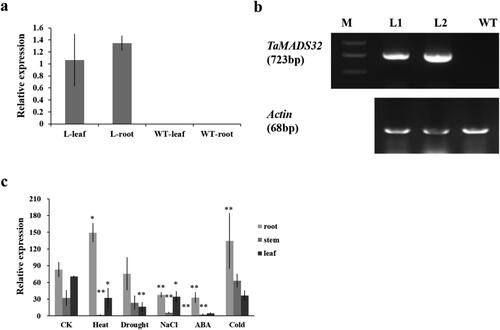
Figure 7. Expression analysis of TaMADS32 in wild-type and transgenic Arabidopsis plants. Relative expression in Arabidopsis plants (a); WT, the wild-type plant; L, the transgenic Arabidopsis. RT-PCR analysis of TaMADS32 gene and Actin in Arabidopsis. M, Marker, L1, L2, transgenic Arabidopsis lines, WT, wild-type Arabidopsis (b); expression patterns of the gene in transgenic Arabidopsis by RT-qPCR in normal conditions, cold, drought, ABA, heat and NaCl stress (c). The expression levels are normalized to Actin with three biological replicates. Note: CK means no stress, * Significance at the 0.05 probability level, **Significance at the 0.01 probability level.
Data availability statement
All data generated or analysed during this study are included in this article; further inquiries can be directed to the corresponding author upon reasonable request.