
Figures & data
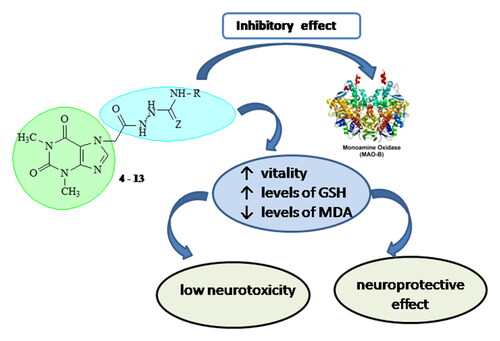
Scheme 1. Synthesis of semi- and thiosemicarbazides of 7-theophylline acetic acid [Citation4–13].
![Scheme 1. Synthesis of semi- and thiosemicarbazides of 7-theophylline acetic acid [Citation4–13].](/cms/asset/ab2da0a5-67d9-46ea-b71c-ca556ffca36a/tbeq_a_2098819_sch0001_b.jpg)
Table 1. ID, structures and yields of newly synthesized compounds.
Table 2. Yields of the isolated product of 2 under conditions of phase-transfer catalysis.
Figure 1. Effect of compounds 1, 3, 4 - 13 administered alone at a concentration of 100 µmol/L on synaptosomal viability. * р<0.05 compared to control (untreated synaptosomes).
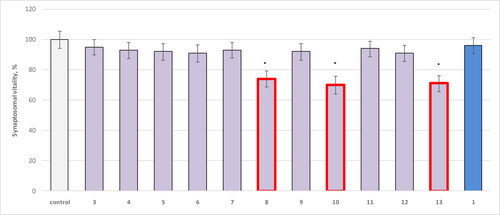
Figure 2. Effect of compounds 1, 3, 4–13 administered alone at a concentration of 100 µM on GSH levels in isolated synaptosomes. **р<0.01 relative to control (untreated synaptosomes).
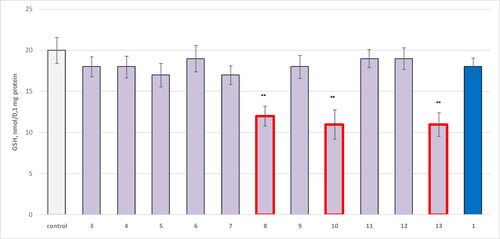
Figure 3. Effect of compounds 1, 3 and 4–13, applied alone at a concentration of 100 µM, on the production of MDA in isolated microsomes. **р<0.01 relative to control (untreated microsomes).
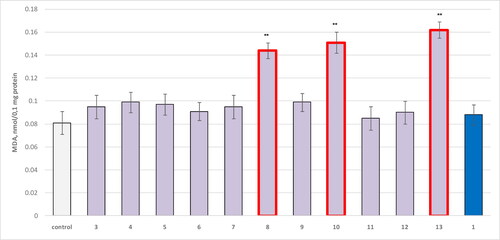
Figure 4. Effect of compounds 1, 3, 4–13 administered alone at a concentration of 100 µmol/L on GSH levels in isolated mitochondria. **р<0.01 compared to control (untreated mitochondria).
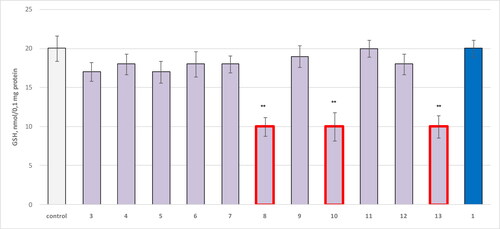
Figure 5. Effect of compounds 1, 3 and 4–13, applied alone at a concentration of 100 µmol/L, on the production of MDA in isolated mitochondria. **р<0.01 compared to control (untreated mitochondria).
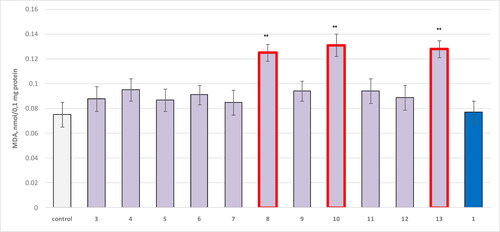
Figure 6. Effect of compounds 1, 3, 4–13 (100 µmol/L), in a model of 6-OHDA-induced oxidative stress, on synaptosomal viability in isolated synaptosomes. ***p < 0.001 compared to control (untreated synaptosomes); ++p < 0.01 compared to 6-OHDA.
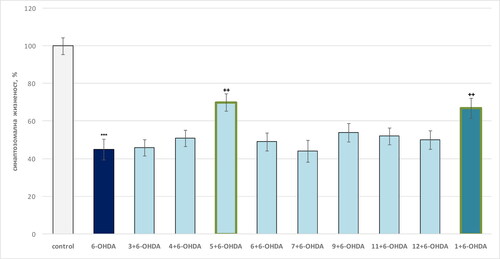
Figure 7. Effect of compounds 1, 3, 4–13 (100 µmol/L), in a model of 6-OHDA-induced oxidative stress, on GSH levels in isolated synaptosomes. ***p < 0.001 compared to control (untreated synaptosomes); ++p < 0.01 compared to 6-OHDA.
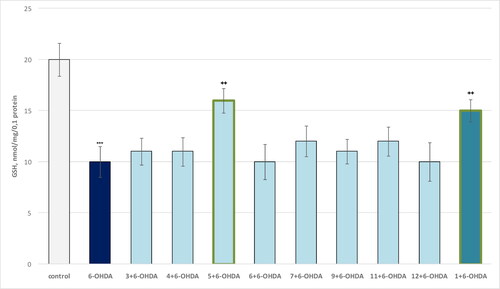
Figure 8. Influence of compounds 1, 3 and 4–13 (100 µmol/L), in a model of non-enzyme-induced lipid peroxidation, on the production of MDA in isolated brain microsomes. ***p < 0.001 compared to control (untreated microsomes); ++p < 0.01 compared to Fe/AA.
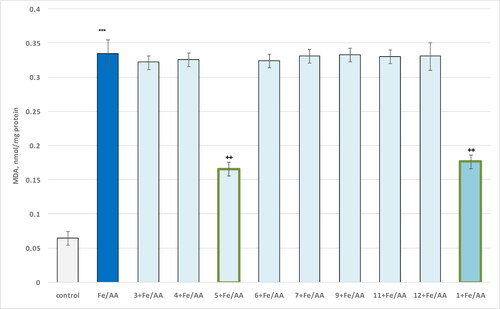
Figure 9. Effect of compounds 1, 3 and 4–13 (100 µmol/L), in a model of t-BuOOH-induced oxidative stress, on MDA production in isolated brain mitochondria. ***p < 0.001 compared to control (untreated mitochondria); ++p < 0.01 compared to t-BuOOH.
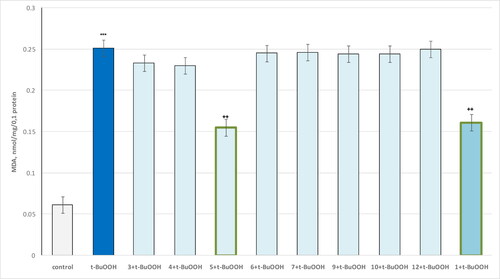
Figure 10. Influence of substances 1, 3 and 4–13 (100 µmol/L), in a model of t-BuOOH-induced oxidative stress, on the GSH level in isolated brain mitochondria. ***p < 0.001 compared to control (untreated mitochondria); ++p < 0.01, compared to t-BuOOH.
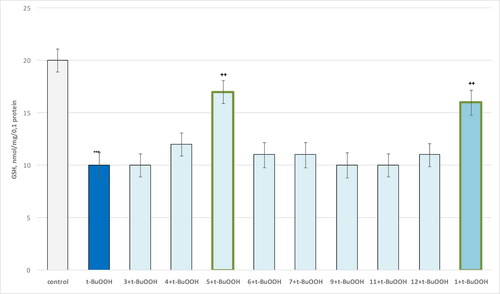
Figure 11. Influence of a series of compounds 3, 4–13, theophylline [Citation1] and selegiline, administered alone, on the activity of hMAOB. **p < 0.01;***p < 0.001 compared to the control (pure hMAOB).
![Figure 11. Influence of a series of compounds 3, 4–13, theophylline [Citation1] and selegiline, administered alone, on the activity of hMAOB. **p < 0.01;***p < 0.001 compared to the control (pure hMAOB).](/cms/asset/eb3e180f-3acf-4716-940c-28b06c2aa9f2/tbeq_a_2098819_f0011_c.jpg)
Supplemental Material
Download PDF (147.7 KB)Data Availability Statement
The data used to support the findings of this study are included within the article and Supplementary material.