
Figures & data
Figure 1. The experimental device for contact oxidation.
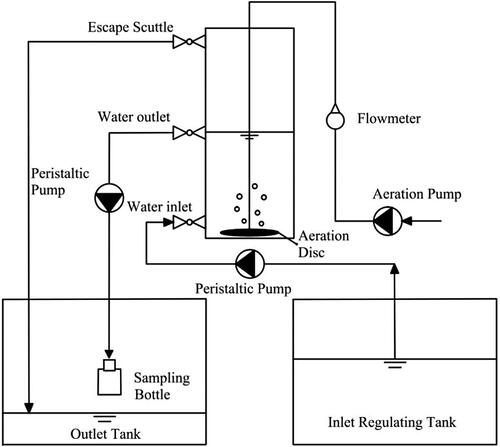
Figure 2. The bar graphs show the concentration of three kinds of pollutants in the inlet and outlet water. The line charts show the removal ratios of different pollutants during start-up period. (a) NH4+-N. (b) TN. (c) CODCr.
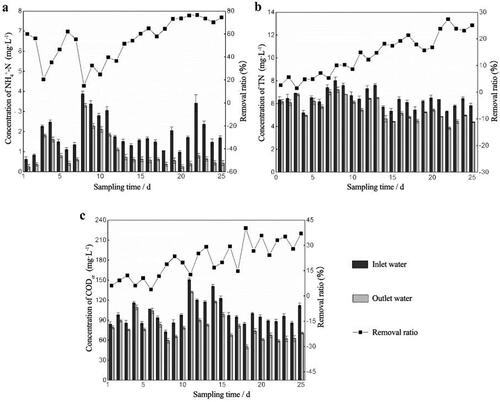
Figure 3. The difference of pollutants concentration in outlet water between the bio-enhanced group and the control group. (* means p < 0.05) Removal ratios of pollutants after adding nothing and adding bacteria when the mixed pollution water was used as the influent. Aeration rate was set to 30 mL·min −1 and the hydraulic retention time was set to 16 h. (a) NH4+-N. (b) TN. (c) CODCr.
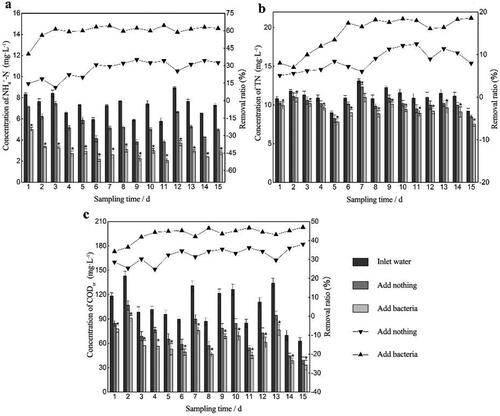
Figure 4. The concentration and removal ratios of different pollutants in the bio-enhancement group under different aeration rate (abbreviated as Q). (a) NH4+-N, Q was 60 mL·min −1. (b) NH4+-N, Q was 90 mL·min −1. (c) TN, Q was 60 mL·min −1. (d) TN, Q was 90 mL·min −1. (e) CODCr, Q was 60 mL·min −1. (f) CODCr, Q was 90 mL·min −1.
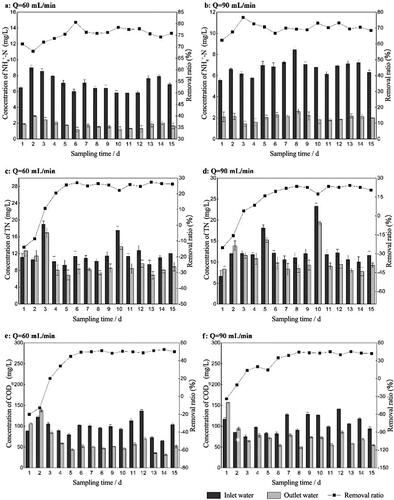
Figure 5. The concentration (bar graphs) and removal ratios (line charts) of different pollutants in the bio-enhancement group under different hydraulic retention time (abbreviated as HRT). (a) NH4+-N, HRT was 8 h. (b) NH4+-N, HRT was 24 h. (c) TN, HRT was 8 h. (d) TN, HRT was 24 h. (e) CODCr, HRT was 8 h. (f) CODCr, HRT was 24 h.
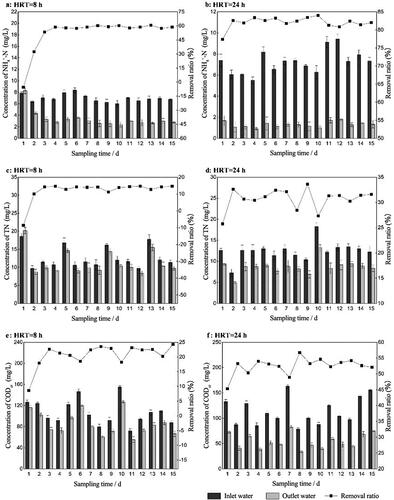
Figure 6. The concentration (bar graphs) and removal ratios (line charts) of different pollutants in the bio-enhancement group and control group under the optimal operation conditions. (a) NH4+-N. (b) TN. (c) CODCr.

Figure 7. The concentration (bar graphs) and removal ratios (line charts) of different pollutants in the bio-enhancement group after RW addition ceased. (a) NH4+-N. (b) TN. (c) CODCr.
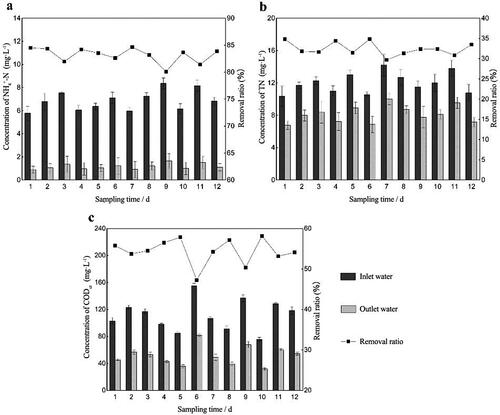
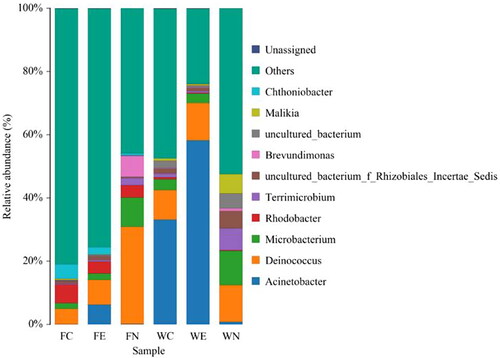
Figure 8. Genus diversity of six samples based on the 16S rDNA gene sequencing technology. Samples included the fillers of the control (FC) and bio-enhanced (FE) groups, the filler after successfully starting-up (FN), the water outlets of the control (WC) and bio-enhanced (WE) groups, the water outlet after successfully starting-up (WN).
Data availability statement
All data generated or analyzed during this study are included in this published article.