
Figures & data
Figure 1. Expression level of AtSUC4 in response to different concentrations of sucrose. (A) 7 d-old pAtSUC4::GUS seedling on MS solid media with different concentrations of sucrose (0%, 2%, 4% and 6%). (B) The relative expression level of GUS in roots of pAtSUC4::GUS plants. (C) The relative expression level of AtSUC4 in roots of 7-d-old WT seedlings under different concentrations of sucrose treatment (0%, 2%, 4% and 6%). Data are mean values ± SE of three biological replicates. Bars with different letters indicate significant differences among treatments for the same stage according to Duncan’s test (at p < 0.05).
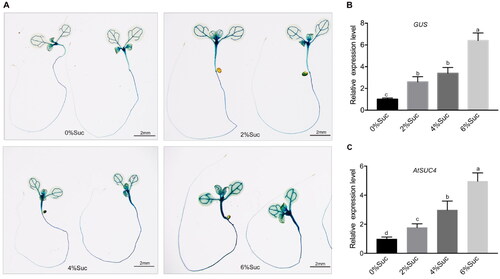
Figure 2. Subcellular localization of AtSUC4. (A) Root image of GFP fusion to the C-terminus of AtSUC4 by stable transformation. (B) Detection of AtSUC4 localization by immune colloidal gold. SE: sieve element, CC: companion cell, PM: plasma membrane. The black arrow represents the gold particles. The right image served as a negative control. (C) The subcellular localization of a GFP fusion to the C-terminus of AtSUC4 by transient transformation of Arabidopsis protoplasts. GFP and RFP indicated the fluorescence of AtSUC4-GFP fusion protein and chlorophyll auto-fluorescence, respectively.
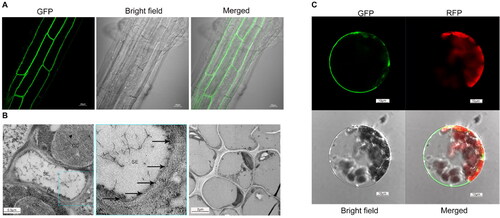
Figure 3. The phenotypic and statistics of primary root length under different concentrations (0%, 2%, 4% and 6%) of sugar treatments: sucrose (A, B); glucose (C, D); mannitol (E, F). The first row plants in (A), (C) and (E) are the shared control group. Data in (B), (D) and (F) are mean values ± SE of three biological replicates. All the plants were grown on MS solid media for 6 days after sowing. Bars with different letters indicate significant differences among genotypes for the same treatment according to Duncan’s test (at p < 0.05), n > 50.
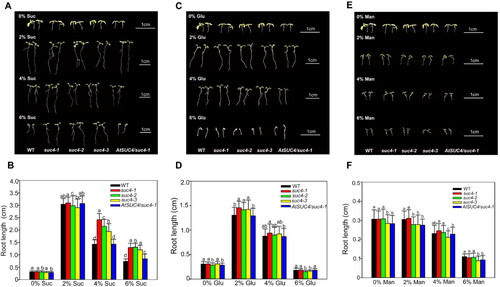
Figure 4. Expression level of genes related to sucrose transport and metabolism, IAA and ABA signalling pathway. (A), (C), (E) Heatmap of representative genes expression related to sucrose, IAA and ABA signalling pathway. (B), (D), (F) Gene expression changes as assessed by RT-qPCR. The relative expression detected by RT-qPCR is represented by a bar graph, and the left ordinate indicates the expression level. FPKM of genes, according to RNA-Seq data, is represented by a line graph, and the right ordinate indicates the FPKM level. Asterisks represent a significant difference compared with WT. The log2 fold change value of the gene expressions from transcriptome is displayed in different colours. Yellow colour means high expression and blue colour means low expression. Each sample was assayed in three biological replicates. The experimental materials were selected from the roots of different plants which were grown on MS solid media with 6% sucrose for 6 days.
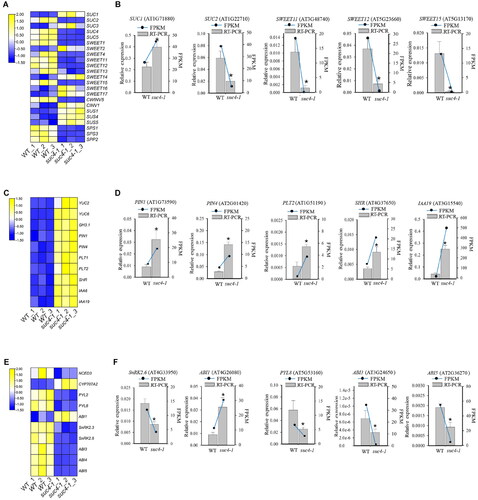
Table 1. Sucrose content in roots of different types of plants.
Table 2. ABA and IAA content in roots of different plants.
Supplemental Material
Download MS Excel (14.7 KB)Supplemental Material
Download PDF (1.1 MB)Data availability statement
The data that support the findings of this study are openly available in [National Center for Biotechnology Information Sequence Read Archive] at [https://www.ncbi.nlm.nih.gov/sra/], reference number [PRJNA666009].