
Figures & data
Figure 1. Schematic diagram of the NGAL-expressing bicistronic vector. The tandem sequences (SS, human NGAL coding sequence, His6×, IRES and EGFP sequences) were inserted into pcDNA3.1 as the acceptor vector, with constitutive expression controlled via the cytomegalovirus (CMV) promoter.
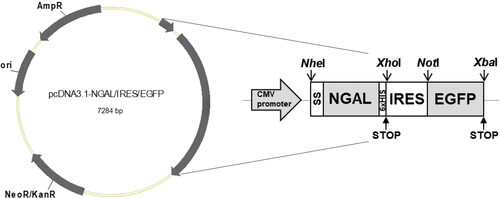
Figure 2. Monitoring EGFP and NGAL expression. (A) Cell morphology and fluorescent protein expression. Transfected 293 T cells were observed under a fluorescence microscope for 14 days after transfection. Images were captured every 2 days using a 20× objective lens (scale bar: 50 µm). D, day. (B) Mean fluorescence intensity of EGFP and NGAL concentration. (C) Correlation between fluorescence intensity and NGAL concentration, calculated using Spearman’s rank correlation test. Results presented are from triplicate experiments (mean ± SEM).
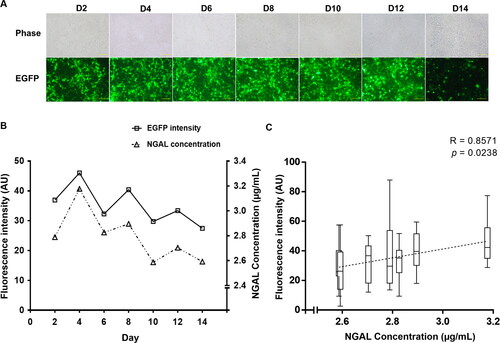
Figure 3. Identification of NGAL protein. (A) SDS-PAGE. Each sample was analyzed under reducing conditions. Lane 1: culture medium control, lane 2: pre-purified supernatant, lane 3: flow-through fraction, lane 4: first eluted fraction, lane 5: second eluted fraction, M: protein marker (kDa) (Thermo Fisher Scientific, Vilnius, Lithuania, cat. no. 26616). (B) Western blotting. The membrane was probed using an anti-His monoclonal antibody.
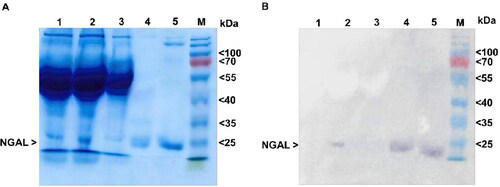
Figure 4. Inhibition of bacterial growth in iron-limited culture. The effect of NGAL on bacterial growth at (A) 6 h and (B) 12 h after treatment. The growth of E. coli culture was defined by measuring turbidity at OD595. Each condition is normalized to OD595 for the non-treated condition (i.e. absence of NGAL and ferric chloride). Results are from triplicate experiments (mean ± SEM). Data were analyzed using one-way ANOVA, followed by post hoc LSD tests. *p < 0.05 and ns = not significant.
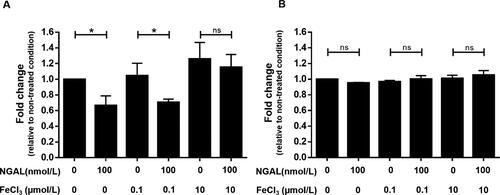
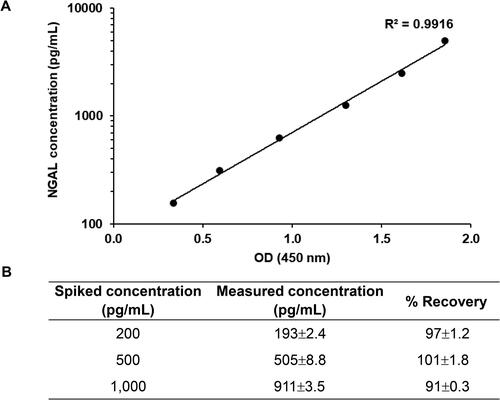
Figure 5. Calibration curve constructed with purified NGAL. (A) Calibration curve for NGAL assay. Purified NGAL was serially diluted twofold and subjected to sandwich ELISA. All values represent the average of three replicates. Background OD values were subtracted from individual OD values. (B) Spiked and standard NGAL recovery concentrations. Three levels of spiked samples were analyzed in the same procedure as the standard protein. Recoveries for spiked samples compared to the measured recovery. Results presented are from triplicate experiments (mean ± SD).
Data availability statement
All data that support this study are available from the corresponding author upon reasonable request.