
Figures & data
Figure 1. Alignment of WRKY conserved domain sequences in cabbage. (MEGA 5.0).
Note: The core sequences are shown in a red box.
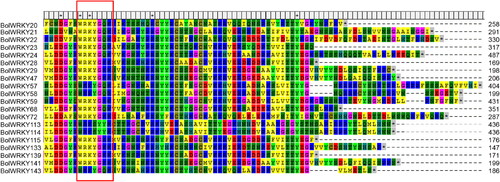
Figure 2. Phylogenetic tree of WRKY proteins in cabbage (EvolView).
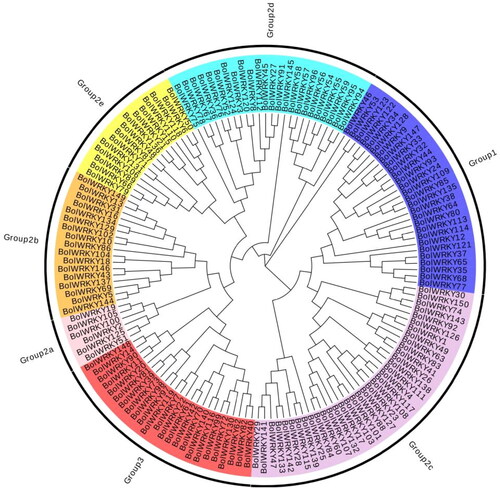
Figure 3. Gene structure and phylogenetic relationship of BolWRKYs. (GSDS 2.0).
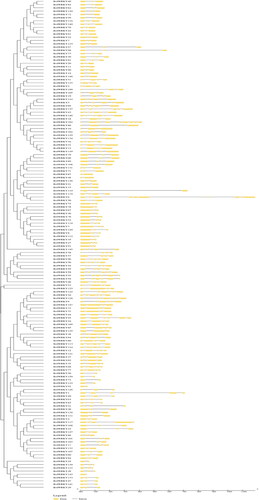
Figure 4. Conserved motif and promoter analysis of BolWRKY genes. (A). The sequence information for each motif of BolWRKYs. (B). Conserved motif distribution of BolWRKY gene family. Different colors represent different motifs. (C). Cis-acting elements of the BolWRKY gene family. Different colors and shapes represent different cis-acting elements and their position in the BolWRKYs. (TBtools).
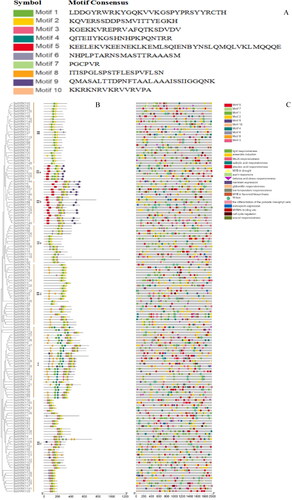
Figure 5. Duplication and synteny of BolWRKY genes. (A). Synteny map of BolWRKY family genes. The red lines represent the collinear relationship between the BolWRKYs on different chromosomes. (B). Synteny map of WRKYs between Arabidopsis and cabbage. Lines of different colors represent the collinear relationship between BolWRKYs and AtWRKYs on different chromosomes. (TBtools).
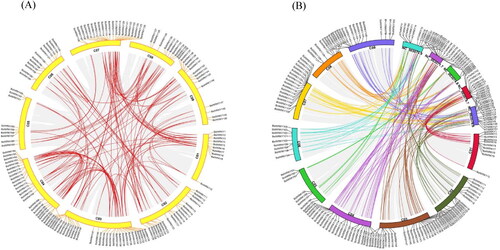
Figure 6. The network of BolWRKY protein functional connections. (STRING v11.0).
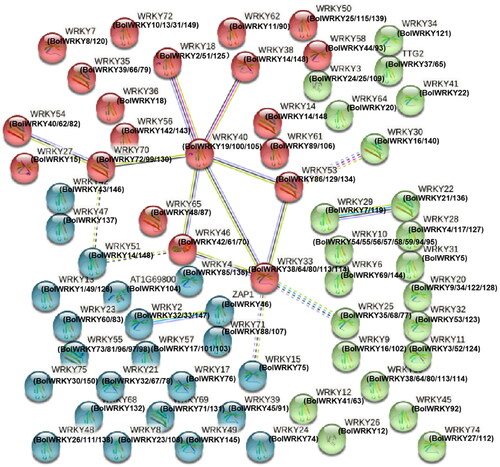
Figure 7. RNA-Seq analysis of BolWRKY genes in different tissues. (TBtools).
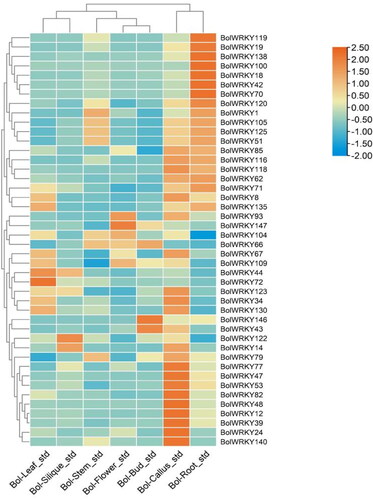
Figure 8. Expression pattern analysis of BolWRKY genes in response to ABA stress. The X-axis represents the RNA samples from the whole plants in different treatment at five time points, from left to right: control (0 h), ABA (3 h, 6 h, 12 h, 24 h). The BolActin2 was used as an endogenous control for normalization of gene transcript level. The Y-axis represents the relative expression levels of BolWRKY genes using the 2−ΔΔCT method. Data represent the mean ± standard deviation (p < 0.05). (GraphPad Prism 8.0).
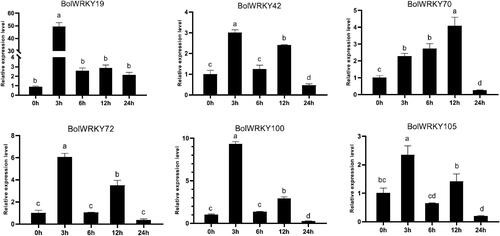
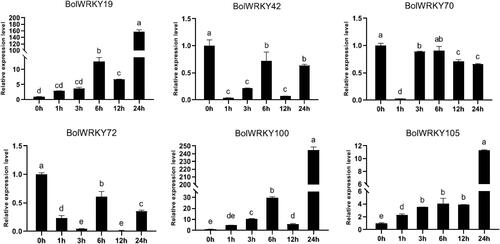
Figure 9. Expression pattern analysis of BolWRKY genes in response to drought stress. The X-axis represents the RNA samples from the whole plants in different treatment at six time points, from left to right: control (0 h), PEG (1 h, 3 h, 6 h, 12 h, 24 h). The BolActin2 was used as an endogenous control for normalization of gene transcript level. The Y-axis represents the relative expression levels of BolWRKY genes using the 2−ΔΔCT method. Data represent the mean ± standard deviation (p < 0.05). (GraphPad Prism 8.0).
Supplemental Material
Download PDF (605.6 KB)Data availability statement
The data that support the findings reported in this paper are available from the corresponding author [YW] upon reasonable request.