
Figures & data
Figure 1. A flowchart for network pharmacology and molecular docking simulation.
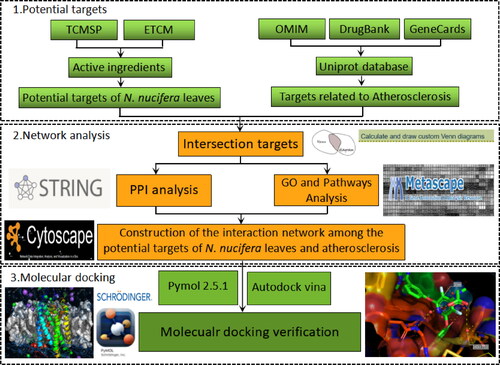
Figure 2. An active ingredient-targets network of N. nucifera leaves (Heye). The diamond nodes stand for the active ingredients of N. nucifera leaves, and the circular nodes for their potential targets. The triangle node stands for the N. nucifera leaf. The connecting lines represent the relationship between the ingredients and the targets.
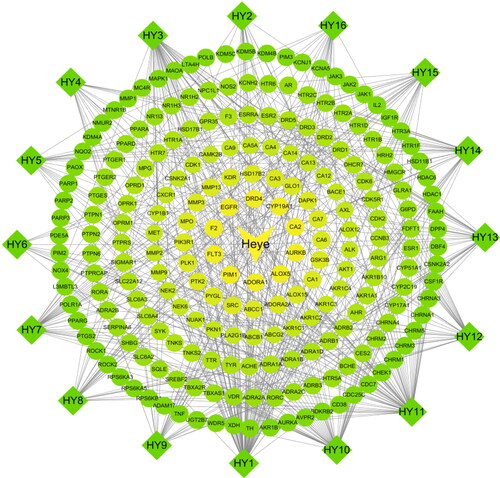
Table 1. Active ingredients of Nelumbo nucifera.
Figure 3. Venn diagram for the targets of active ingredients of N. nucifera leaf and atherosclerosis drugs.
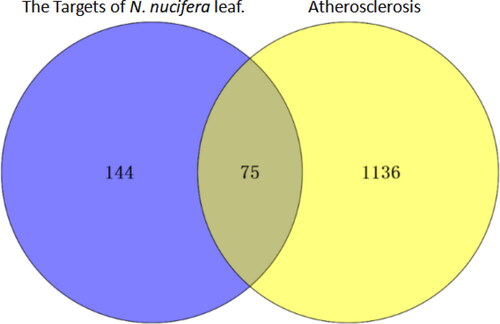
Figure 4. PPI network of the common targets of N. nucifera leaf and atherosclerosis. The octagons represent the common targets, and the lines stand for the interaction of targets.
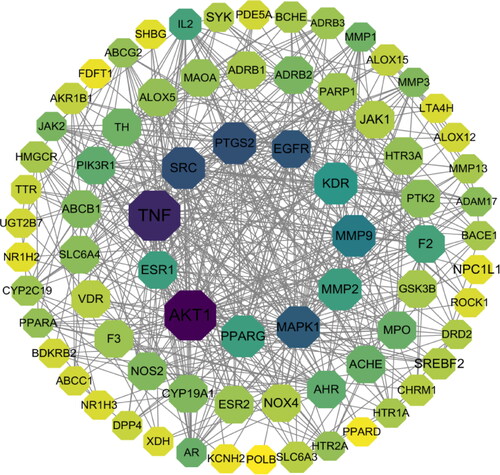
Table 2. Core targets of N. nucifera leaves in treating atherosclerosis.
Figure 5. Bubble diagram for the GO functions enrichment of the common targets. BP: Biological Process; CC: Cellular Component; MF: Molecular Function.
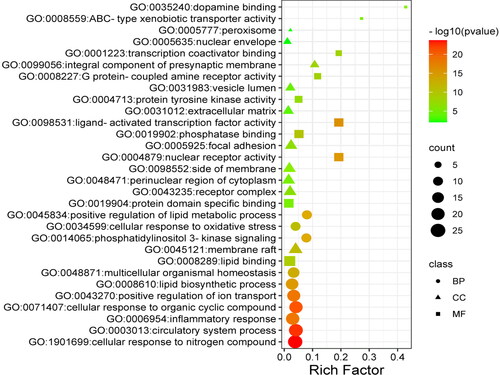
Figure 6. KEGG pathways enriched in the common targets.
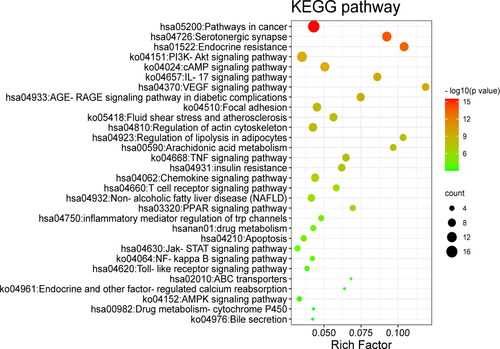
Figure 7. Active ingredient-target-pathway network. The purple triangle nodes represent the pathways, the light green octagon nodes and the dark green diamonds separately represent the targets and active ingredients of N. nucifera leaves.
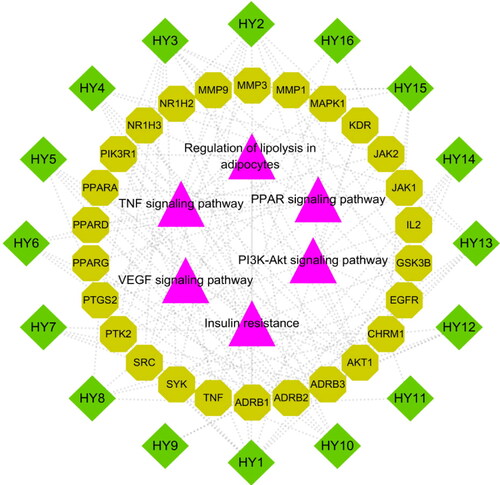
Table 3. Results of molecular docking simulation.
Figure 8. Results of molecular docking between the active ingredients and the core targets of N. nucifera leaves: quercetin to AKT1 (a); quercetin to SRC (b); quercetin to EGFR (c); quercetin to MMP9 (d); quercetin to VEGFR-2 (e); sitosterol to PPARG (f); pronuciferine to MMP9 (g); nuciferine to PTGS2 (h); nelumboside to TNF (i); nelumboside to PTGS2 (j); kaempferol to MMP9
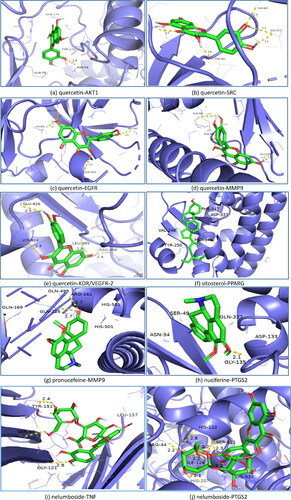
Figure 8. (k); isorhamnetin to EGFR (l).
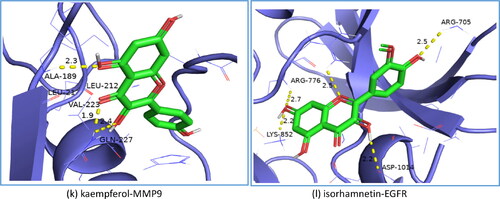
Figure 9. Oil Red O staining of aortic vessels of male Apoe deficient (Apoe-/-) mice in different groups and wild-type (control) C57BL/6J mice. Treatment was initiated at 17 weeks of age and continued for another 8 weeks with intragastrical administration. Low-dose, Middle (Moderate)-dose and High-dose groups were, respectively, given a dose of 4.51 g/kg/d, 9.01 g/kg/d and 18.02 g/kg/d of herbal decoction of N. nucifera leaves, while the control and model group were given 0.9% normal saline. The Simvastatin group was given 3.00 mg/kg/d of Simvastatin solution as a positive control. The red areas represent the atherosclerotic plaques of aortic vessels of mice in different groups.
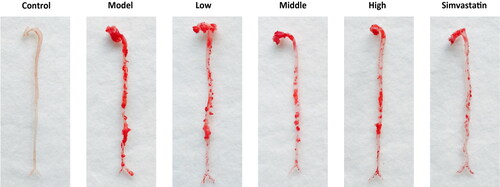
Figure 10. N. nucifera leaves improve the levels of serum lipids in an AS mouse model. A to D, Serum TG (A), TCHO (B), HDL (C) and LDL (D) levels. The levels of serum TG, TCHO, HDL and LDL of mice in each group were examined with an automatic biochemical analyzer, with TG, TCHO, HDL and LDL testing kits, respectively.
Note: Values are means ± SEM (n = 6–8; each data point represents 1 mouse). ***P<0.001 (Control vs. Model) or (Model vs. Low, Middle, High, Simvastatin group), **P<0.01 for LDL (Model vs. Low, Middle, High, Simvastatin group), ns. P > 0.05 for TG (Middle vs. High) or HDL (Low vs. Middle) or LDL (Low vs. Middle) by one-way ANOVA followed by Bonferroni or Tamhane’s T2 post-test.
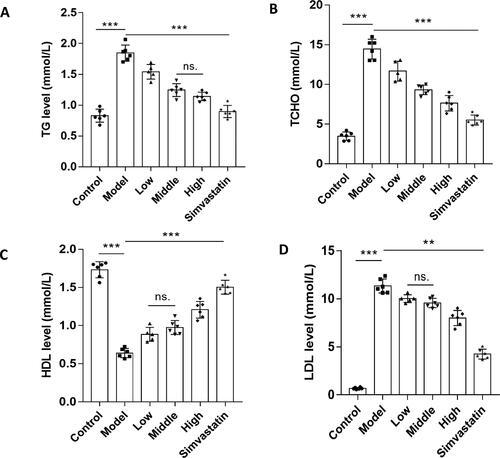
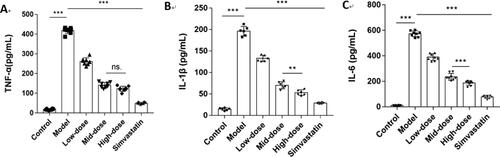
Figure 11. N. nucifera leaves lowered the levels of inflammatory factors in an AS mouse model. Serum TNF-α (A), IL-1β (B) and IL-6 (C) levels measured by ELISA (n = 6–8; each data point represents 1 mouse).
Note: Values were shown as means ± SEM, ***P<0.001 (Control vs. Model) or (Model vs. Low-dose, Mid-dose, High-dose, Simvastatin), **P<0.01 for IL-1β (Mid-dose vs. High-dose), ns.P > 0.05 for TNF-α (Mid-dose vs. High-dose) by one-way ANOVA followed by Bonferroni or Tamhane’s T2 multiple comparisons test.
Data availability
The data used to support the findings of this study are available from the corresponding authors upon reasonable request.