
Figures & data
Figure 1. Bacterial PCR electrophoresis map. The bands in lanes 1 and 2 are bright and clear, there is no smear in the lanes, and the band size is in line with the target.
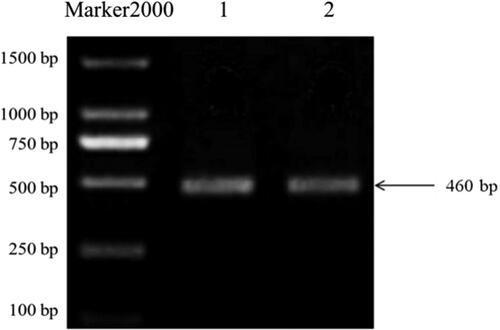
Figure 2. Sample dilution curve. Taking the randomly selected amount of sequencing data as the abscissa, and the Sobs index of the number of observed species as the ordinate, the red curve represents the new pit mud (sample 1), and the blue curve represents the old pit mud (sample 2).
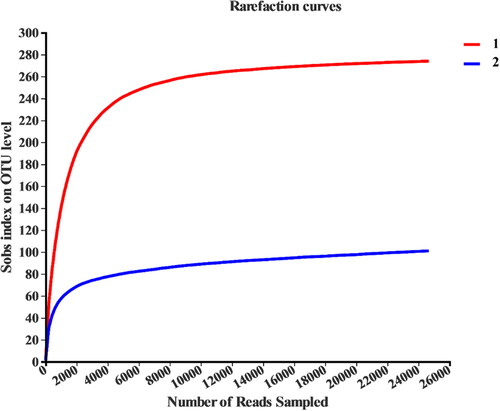
Table 1. High-throughput sequencing diversity index.
Figure 3. OTU-Venn diagram of different samples. Sample 1, New pit mud; Sample 2, Old pit mud.
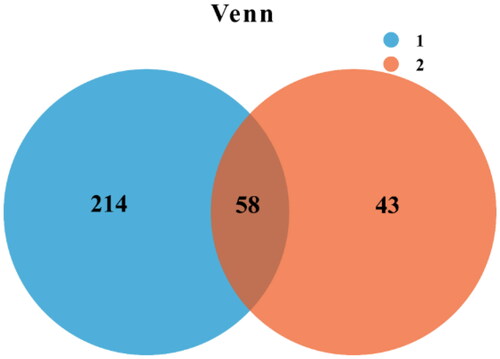
Figure 4. Phylum level of bacterial community structure. Sample 1, New pit mud; Sample 2, Old pit mud.
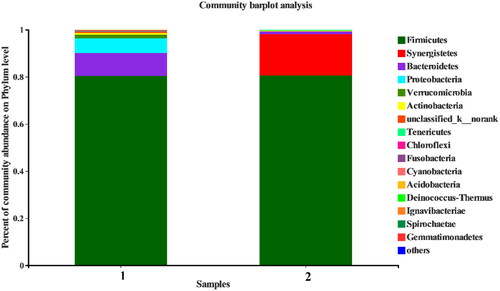
Figure 5. Pie chart of genus community distribution of sample 1 (new pit mud).
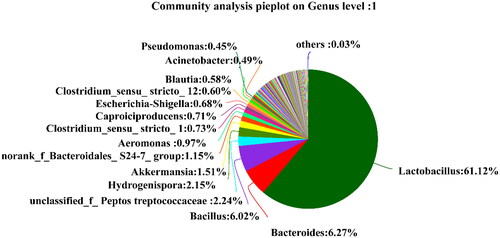
Figure 6. Pie chart of genus community distribution of sample 2 (old pit mud).
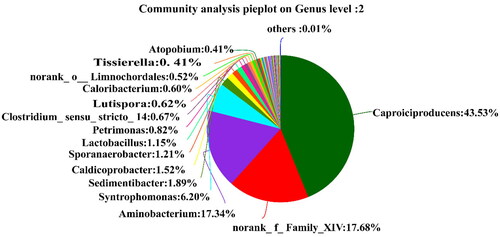
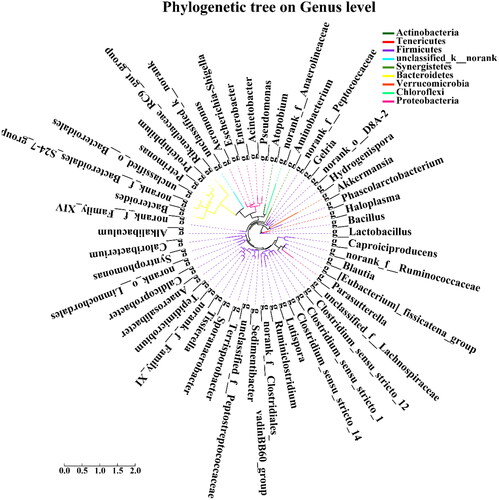
Figure 7. Phylogenetic tree of the top 50 most abundant OTUs in the pit mud of the new factory and the old factory. Each branch in the evolutionary tree represents a class of species, and the branches are coloured according to the advanced taxonomic level to which the species belongs. The length of the branch is the evolutionary distance between two species, that is, the degree of difference between species.
Data availability
All data that support the findings from this study are available from the corresponding author upon reasonable request.