
Figures & data
Figure 1. Prediction performance (AUC) using different sliding window sizes for PDNA-62 and PDNA-224 over five-fold cross-validations..
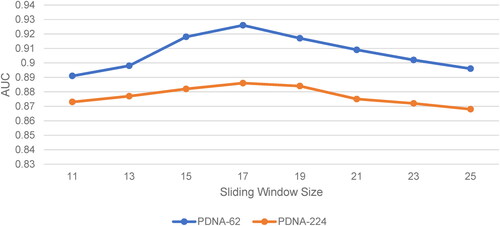
Figure 2. An example of proposed 1-stage adjustment algorithm (a) and 2-stage adjustment algorithm (b).
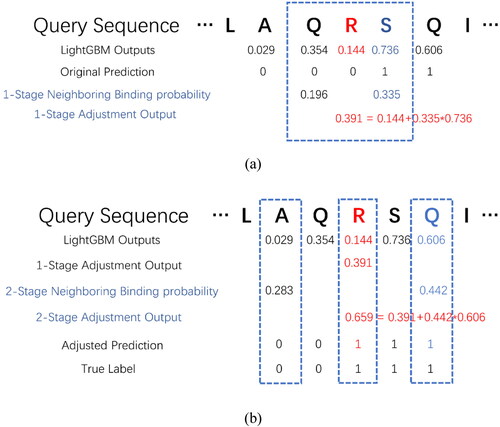
Table 1. Prediction performance of individual feature and different feature combinations on PDNA-62 and PDNA-224 over five-fold cross-validations.
Figure 3. Heatmap of of PDNA-62 (a) and PDNA-224 (b).
Note: The x-axis and y-axis denote the 20 amino acid types, and every element denotes a specific .
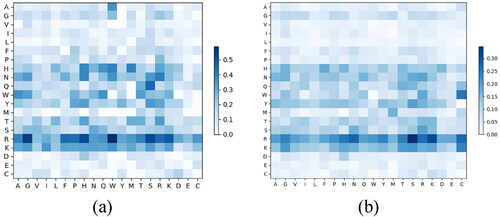
Table 2. Prediction performance of original LightGBM outputs, 1-stage adjustment, 2-stage adjustment and higher stage adjustment algorithm on PDNA-62 and PDNA-224 over five-fold cross-validations.
Figure 4. Threshold selection for 1-stage and 2-stage adjustment algorithm on PDNA-62 and PDNA-224 over five-fold cross-validations.
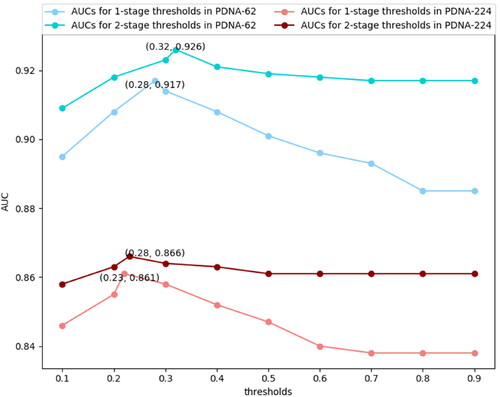
Table 3. Prediction performance of our proposed method and other state-of-art methods on PDNA-62 over five-fold cross-validations.
Table 4. Prediction performance of our proposed method and other state-of-art methods on PDNA-224 over five-fold cross-validations.
Figure 5. AUC comparison between our proposed method and other prediction methods on the independent testing set TS-72.
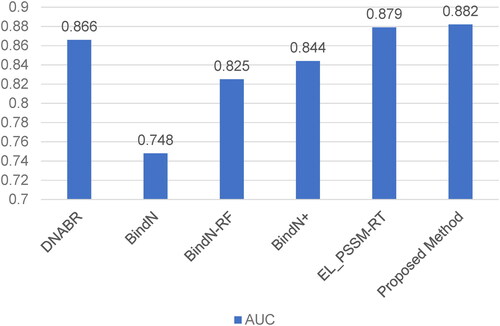
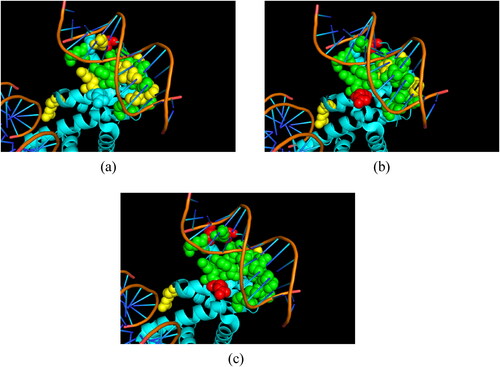
Figure 6. The prediction result of 3PVP_A of original LightGBM outputs (a), 1-stage adjustment algorithm (b) and 1-stage and 2-stage adjustment algorithm (c). The green spheres, yellow spheres and red spheres denote the true positive (TP) instances, false negative (FN) instances and false positive (FP) instances, respectively.
Data availability statement
The data that support the findings of this study are openly available at https://github.com/tlsjz/DNAbinding.