
Figures & data
Table 1. Reimbursed cost per diagnosis during 2016–2020 (BGN).
Table 2. Reimbursed medicines, cost, and utilization indicators.
Figure 1. Relative share of the INN expenditures.
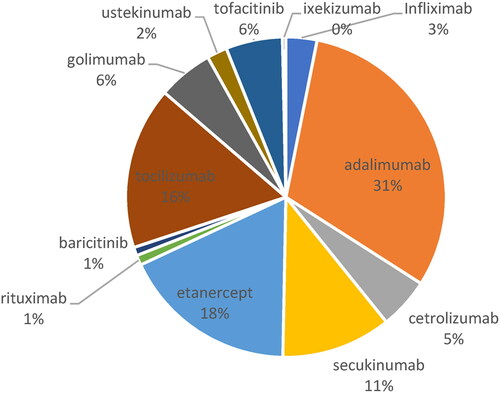
Figure 2. Total cost (TC) per year for all observed INNs.
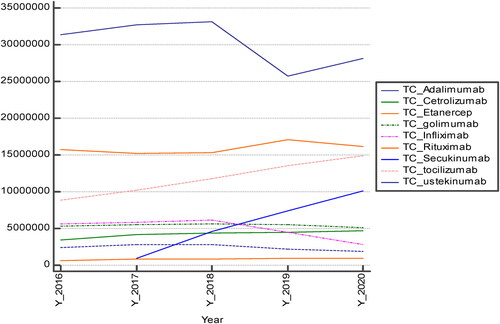
Table 3. Cost data correlation analysis.
Table 4. Correlation analysis between prices, utilization, and reimbursed cost of observed INNs.
Data availability statement
The data used for the analysis are available from the corresponding author upon reasonable request.