
Figures & data
Figure 1. PCR analyses of acdS gene in B. cereus. M: DNA Marker (DL 2000); 1: 996 bp PCR products.
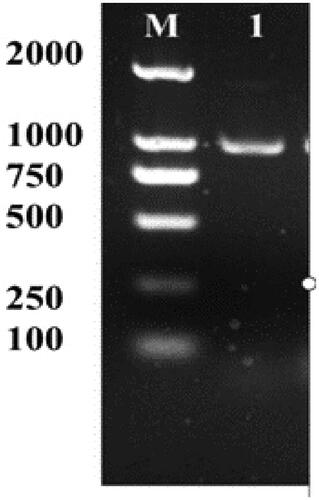
Figure 2. PCR products of fusion gene from tobacco total DNA. (M: DL2000 Maker; WT: wild tobacco; T1-T23: Transgenic tobacco plants).
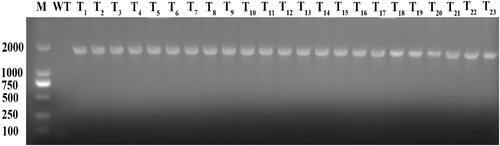
Figure 3. Protein expression analysis of T3 generation transgenic lines. (a) GFP-acdS protein; (b) GAPDH protein. (M: Protein marker; C: wild tobacco control; T6-1 - T6-6: transgenic tobacco plants).
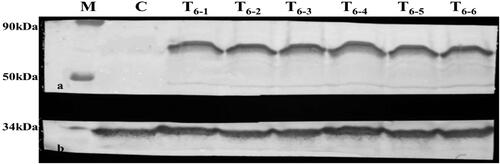
Figure 4. Subcellular localization of transgenic plant acdS-GFP.
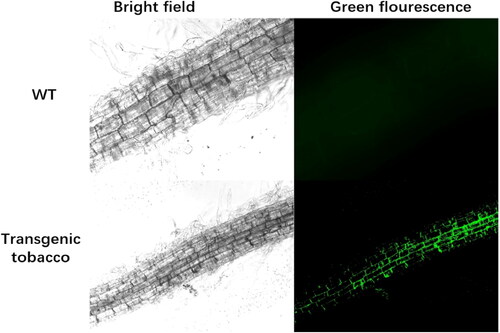
Figure 5. Comparison between T3 generation transgenic tobacco and wild tobacco in liquid culture with different NaCl concentrations. T, transgenic tobacco; WT, wild-type tobacco.
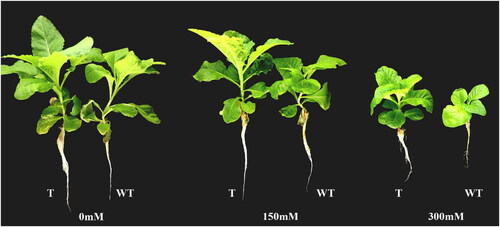
Figure 6. Growth status of T3 generation transgenic tobacco and wild-type tobacco under different salt concentrations. Comparison of plant height (A), root length (B), dry weight (C) and fresh weight (D) between transgenic tobacco and wild-type tobacco.
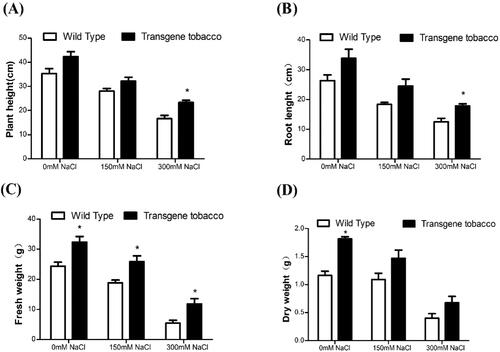
Figure 7. Chlorophyll content of T3 generation transgenic tobacco and wild tobacco under different salt concentrations.
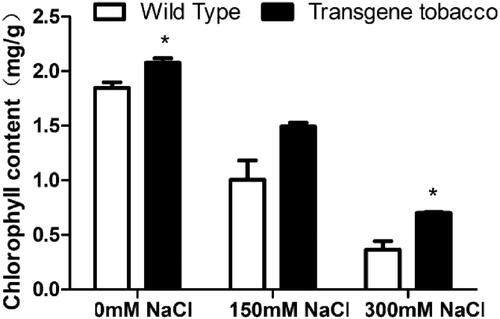
Figure 8. Proline content in T3 generation transgenic tobacco and wild-type tobacco at different salt concentrations.
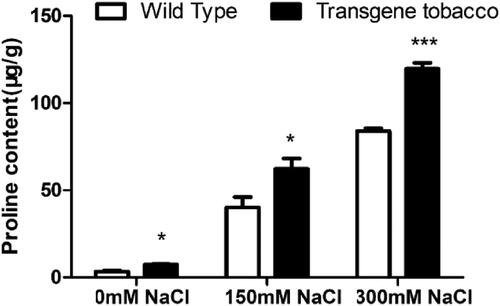
Figure 9. Physiological and biochemical characteristics of T3 generation transgenic tobacco under different NaCl concentrations. POD activity (A); CAT activity (B); SOD activity (C).
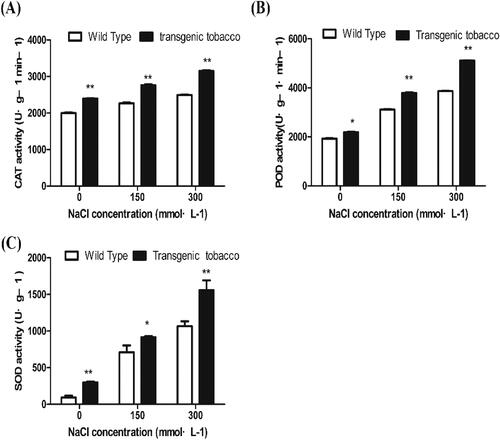
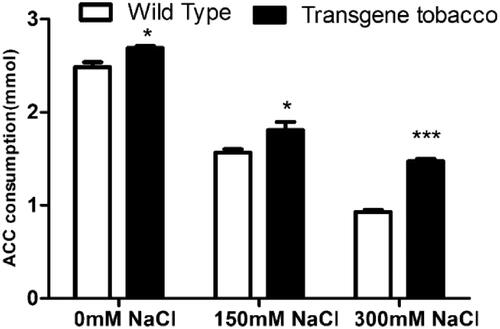
Figure 10. ACC consumption of transgenic and wild tobacco at different salt concentration.
Data availability statement
All data that support the findings reported in this study are available from the corresponding author upon reasonable request.