Figures & data
Table 1. Predicted CYP1A2, CYP2D6, and CYP3A4 inhibition potency of choline and the positive controls with the DL-CYP Prediction Server.
Figure 1. Effect of choline on CYP1A2 activity in vitro. Five concentrations of choline and α-naphthoflavone (as a selective inhibitor) were assayed: 0.150, 0.250, 0.500, 0.750, and 1 µmol/L. *p < 0.05; **p < 0.01 vs. control (pure CYP1A2).
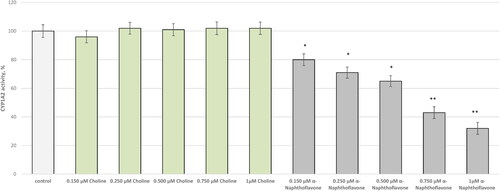
Figure 2. Effect of choline on CYP2D6 in vitro. Five concentrations of choline and quinidine (as a selective inhibitor) were assayed: 0.150, 0.250, 0.500, 0.750, and 1 µmol/L. *p < 0.05; **p < 0.01 vs. control (pure CYP2D6).
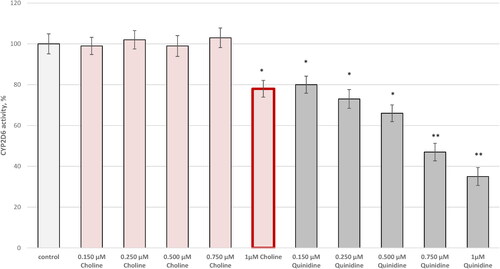
Figure 3. Effect of choline on CYP3A4 activity in vitro. Five concentrations of choline and ketoconazole (as a selective inhibitor) were assayed: 0.150, 0.250, 0.500, 0.750, and 1 µmol/L. *p < 0.05; **p < 0.01 vs. control (pure CYP3A4).
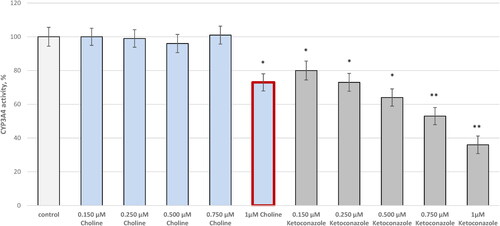
Table 2. Scoring method, docking scores, participating active residues and distance from the heme structure in docking simulations of choline in the active site of CYP1A2, CYP2D6, and CYP3A4 employing XP, IFD, and MM/GBSA recalculations (Schrödinger Inc.).
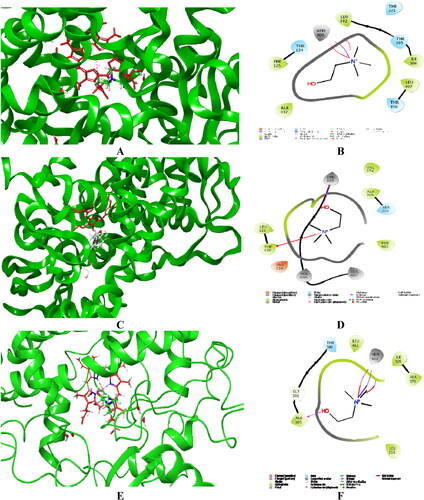
Figure 4. Visualized major intermolecular interactions of choline in the active sites of CYP1A2 (A, B), CYP2D6 (C, D), and CYP3A4 (E, F) after employing IFD and MM/GBSA recalculations. The interactions are provided in both 2D and 3 D forms. The enzyme structures are depicted in green, and the heme group is given in red colored sticks.