
Figures & data
Figure 1. Schematic representation of the outdoor experimental set-up.
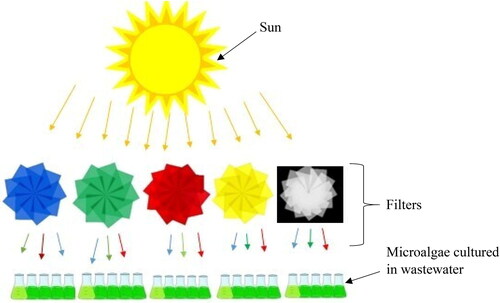
Table 1. Means of the physiochemical parameters of the sterilised wastewater analysed prior to its use as medium.
Figure 2. Growth profiles of the native and imported Chlorella sp. under green (a), blue (b), yellow (c) and red (d) coloured and transparent (e) solar light filters. Figures (a) - (d) demonstrate an exponential growth phase during the first 2 days and (e) shows no increase in growth within that period. Each data point is a mean value of three replicates. Error bars indicate ± SD of the means.

Figure 3. Growth rate comparisons of the native and imported Chlorella sp. under green, blue, yellow, red and transparent light filters. Values are means ± SD. Different letters above bars indicate statistically significant differences.
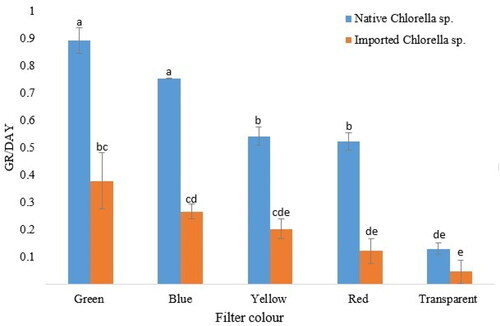
Figure 4. Lipid yield of the native and imported Chlorella strains under the blue and green coloured light filters. Values are means ± SD for duplicate samples.
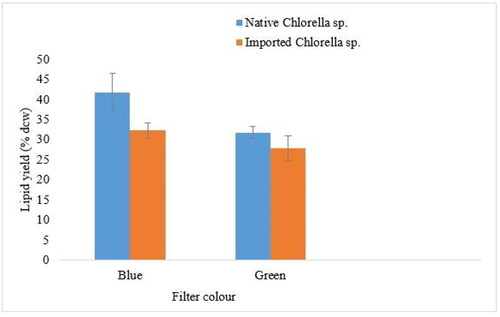
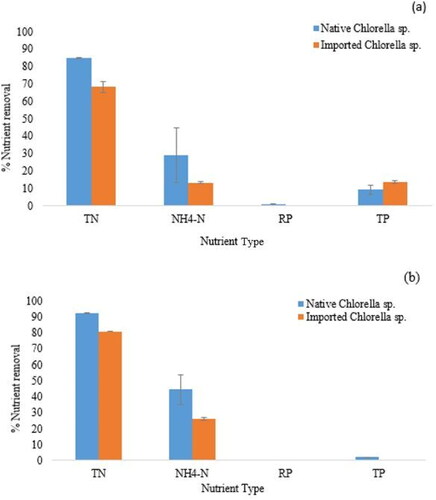
Figure 5. N and P phycoremediation capacities of the native and imported Chlorella strains under green (a) and blue (b) coloured light filters. Data are mean values ± SD.
Data availability statement
The data that support the findings of this study are openly available in [figshare] at [https://doi.org/10.6084/m9.figshare.20359293.v1].