
Figures & data
Figure 1. Map of the study area around the non-ferrous metal plant ‘KCM 2000 Group’, Southern Bulgaria and locations of the sampling sites.
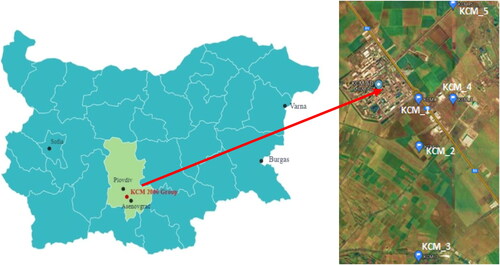
Figure 2. Log-transformed values of soil physicochemical properties (A) and HM concentrations (B) near the non-ferrous metal plant.
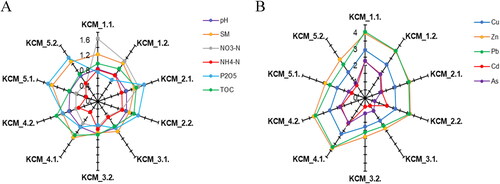
Figure 3. Values of Nemerow pollution index (NPI) calculated for surface layers (blue bars) and subsurface layers (yellow bars) of the soils in the vicinity of the non-ferrous metal plant. KCM_1–5, five sampling sites.
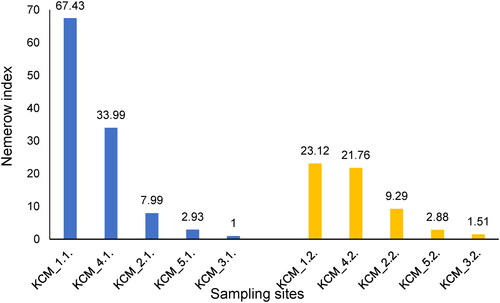
Figure 4. Soil enzyme activity indices (EAIs) of surface soil layers (blue bars) and subsurface soil layers (yellow bars) in the vicinity of the non-ferrous metal plant.
Note: Same letters indicate significant differences (p < 0.05) according to Tukey’s pairwise post-hoc test.
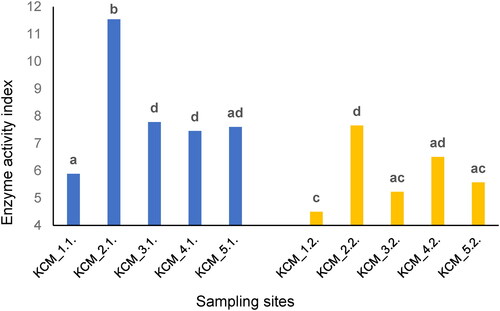
Table 1. Enzyme activitiesTable Footnotea (µg g−1 h−1) of dehydrogenase, β-glucosidase, alkaline and acid phosphatases, arylsulphatase and urease.
Table 2. SIMPER analysis of soil enzyme activities contributing to the functional dissimilarity between soils in the Bray-Curtis dissimilarity matrix.
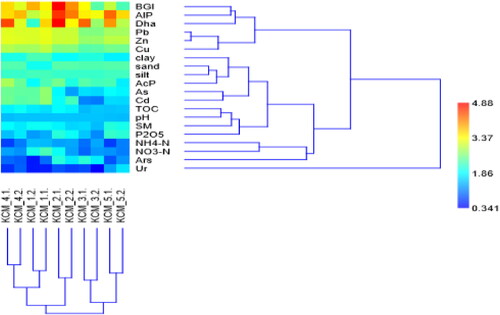
Figure 5. Dendrogram of two-way clustering (UPGMA) of soil sites, abiotic and biotic metrics based on the Bray-Curtis similarity matrix.
Data availability statement
The data that support the findings of this study are available from the corresponding author upon reasonable request.