
Figures & data
Figure 1. Scaled and not scaled log transformed RPM (reads per million) top differentially abundant phages (FDR, Welchs t test with Benjamini–Hochberg < 0.05) pooled by the corresponding families. The phages in the family Myoviridae are overrepresented (p < 0.01) in the set that differentiated high and low AMR samples. AF Africa, AS Asia, EU Europe, NA North America, ME Middle East, OC Oceania, SA South America.
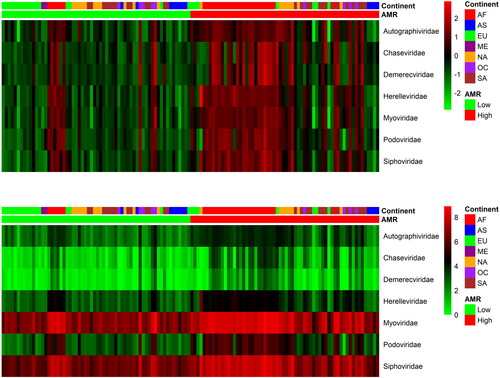
Figure 2. Distributions of phages. Distribution across Category (a), high AMR (red) and low AMR (green); and distribution across Continents (b), AF Africa, AS Asia, EU Europe, NA North America, ME Middle East, OC Oceania, SA South America.
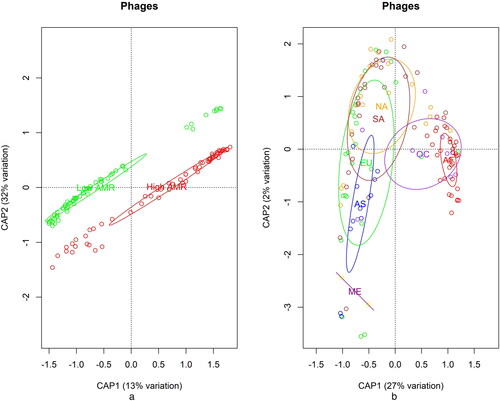
Figure 3. Relative risk (log scale) plots based on Bayesian hierarchical model for the pulled abundance for all phages that are associated with Staphylococcus aureus (a), Staphylococcus aureus and Acinetobacter baumannii (b) and Salmonella enterica (c). Here, the SIR ratio is observed phage abundance while expected is proportional to their host abundance. AF Africa, AS Asia, EU Europe, NA North America, ME Middle East, OC Oceania, SA South America.
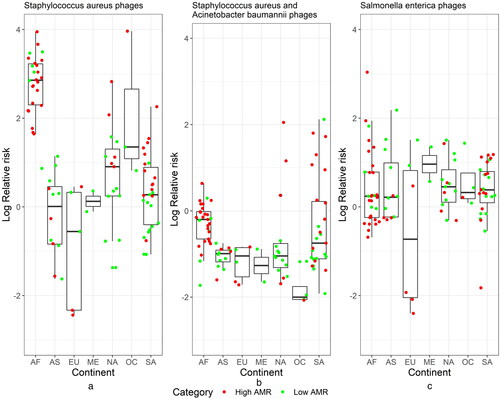
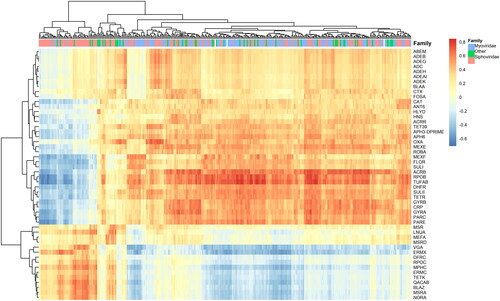
Figure 4. Correlations among phages and ARGs. The two clusters are between phages from Myoviridae family and genes such as acrB, parE, rpoB and tufAB and Siphoviridae and genes such as blaZ, ermX, mphC, tetK, vga.
Data availability statement
The datasets analyzed in this study can be found at http://camda2022.bioinf.jku.at/agreement.
Sofia University St. Kl. Ohridski