
Figures & data
Figure 1. Plate colony characteristics and cell morphology under microscope of LYBC06 strain. (a) MRS medium; (b) microscopic morphology at magnification: 100 × 10.
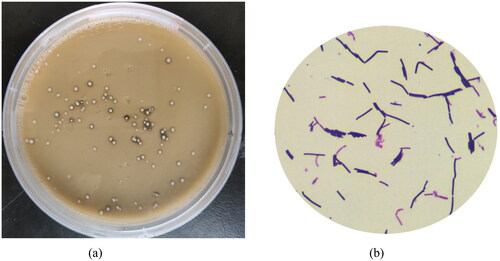
Figure 2. Homologous evolutionary tree of LYBC06 strain based on 16S rDNA gene sequence. Note: The sequence homology between LYBC06 strain and the strain with downloaded sequence information was more than 94%, so the strain LYBC06 was identified as Bacillus coagulans.
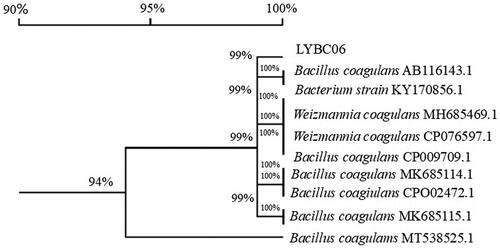
Figure 3. Sequencing depth and cumulative distribution of LYBC06 strain. Note: The data obtained from the sequencing of the LYBC06 strains revealed a good coverage with the reference genome, the sequencing depth coverage at least 1× was 81.01%, and coverage at least 4× was 80.84%.
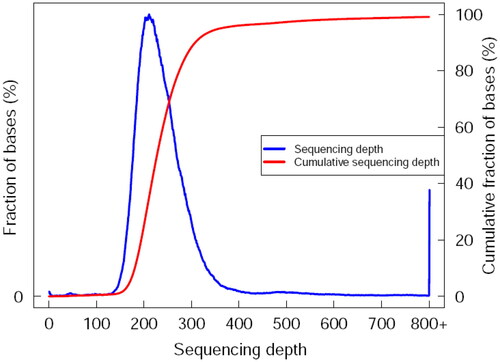
Figure 4. KEGG analysis and statistics of LYBC06 stain. Note: The predicted protein-encoding genes of LYBC06 strains in KEGG annotation, the most numerous metabolic pathway categories were: global and overview maps, carbohydrate metabolism, amino acid metabolism, metabolism of cofactors and vitamins, membrane transport and energy metabolism.
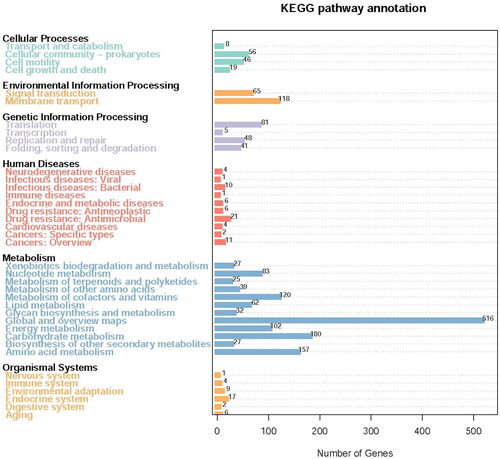
Figure 5. COG function classification of LYBC06 stain. Note: The predicted protein-encoding genes of LYBC06 strains in COG annotation, the most numerous category of metabolic pathways was amino acid transport and metabolism, followed by carbohydrate transport and metabolism and energy production and conversion.
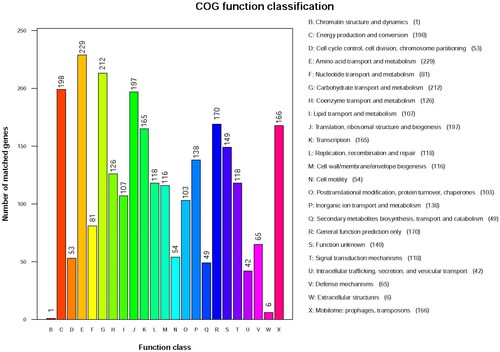
Figure 6. Number of notes in CARD database of the first 11 resistance genes of LYBC06 strain. Note: The predicted protein-encoding genes of LYBC06 strains in CARD database annotation, the top 3 resistance genes with the largest number of genes were ARO: 3000535 (22), ARO: 3002987 (11), and ARO: 3003980 (8).
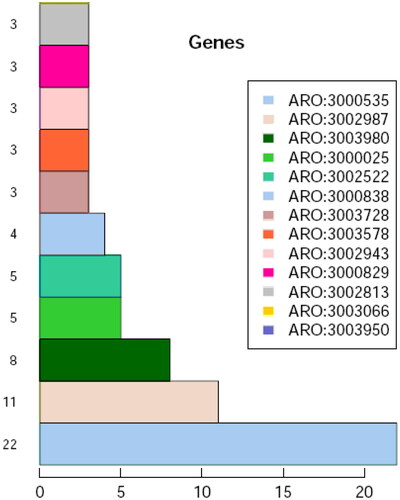
Figure 7. Genome circle of LYBC06 strain. Note: The whole genome sequence of LYBC06 strain was a circular chromosome with a total length of 3.38MB. From the outside to the inside, they were the location coordinates of the genome sequence, the encoded genes, the results of gene function annotation, ncRNA, the GC content of the genome and the GC skew value of the genome.
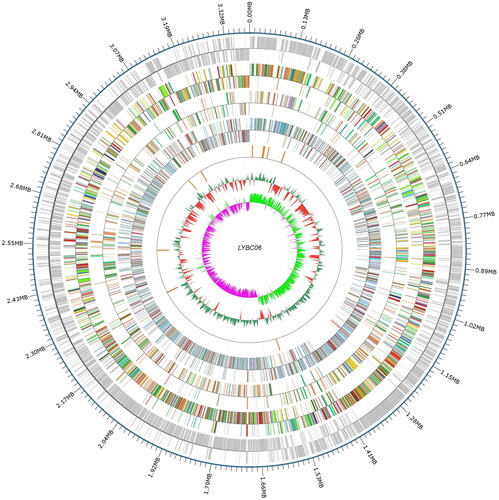
Table 1. Analysis of lactate dehydrogenase related genes in the genome of LYBC06 strain.
Figure 8. Common genome of four Bacillus coagulans strains. Note: The strains had 2530 common protein coding genes, while LYBC06 train had 809 specific protein coding genes.
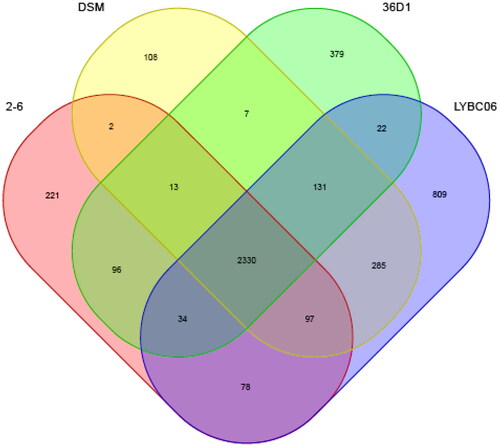
Figure 9. Synteny block of four Bacillus coagulans strains genomes. Note: The same color module represents the collinear region. Good co-linearity of the LYBC06 strain and other Bacillus coagulans strains and 4 locally co-linear blocks (LCBs) were shown.
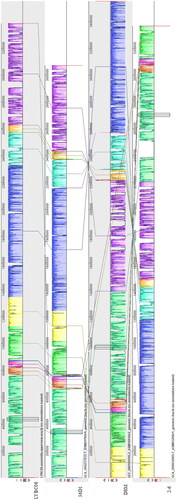
Table 2. General genomic information of 4 Bacillus coagulans strains.
Figure 10. Growth, pH change and Lactic acid production curve of LYBC06 strain. Note: The lactic acid production was basically synchronized with the growth of LYBC06 strains, and the maximum amount of lactate could be produced up to 92 g/L at 16 h culture during the logarithmic growth phase. In terms of pH change, during the early stage of bacterial growth (0–6 h), the pH revealed a rapid decrease and sequentially, it was stabilized at pH 4.5.
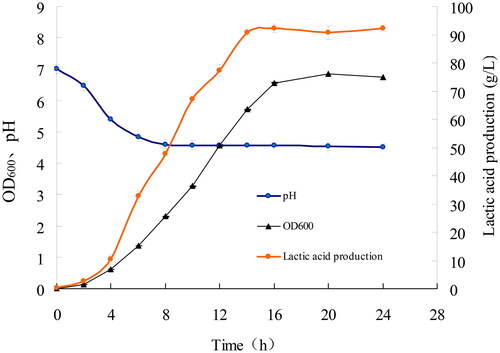
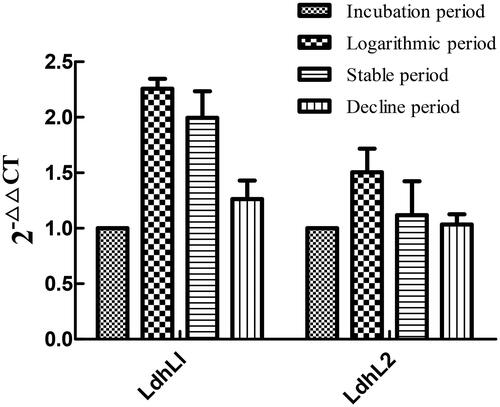
Figure 11. Relative expression value of lactate dehydrogenase gene in LYBC06 strain at different growth stages. Note: The 2-△△CT values of LdhL1 and LdhL2 gene expression at the transcriptional level in LYBC06 strains during different growth periods all showed an initial increase followed by a sequential decrease, with the highest expression level at the logarithmic phase, and the relative expression level of LdhL1 gene was higher than that of LdhL2 gene during different growth periods.
Data availability statement
The data that support the findings from this study are available from the corresponding authors [YL and XHC] upon reasonable request.