
Figures & data
Table 1. Number of samples and their sampling point locations in Selangor.
Figure 1. Scheme of cell immobilization setup. (1) Magnetic drive; (2) Magnetic rod; (3) Microbial filter (0.2 µm); (4) Silicon tube (0.2 mm); (5) Peristaltic pump; (6) Cable tie. (A) The medium preparation vessel of the alginate-cell mixture recipe. (B) The hardening medium (0.2 mol L−1 CaCl2.5H2O solution) vessel, with a volume of 0.25 L scourge bottle.
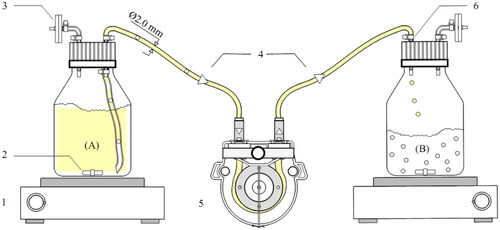
Figure 2. Growth profiles of the individual (SI: O. intermedium; SII: B. paramycoides), and mixed bacteria strains (SI + SII) on enriched mineral salt medium (EMSM) supplemented with 1% UEO (at pH 7.0, 32 °C temperature, and 150 rpm agitation rate). Data points represent the mean of three replicate flasks and error bars that represent standard deviation were removed for clarity.
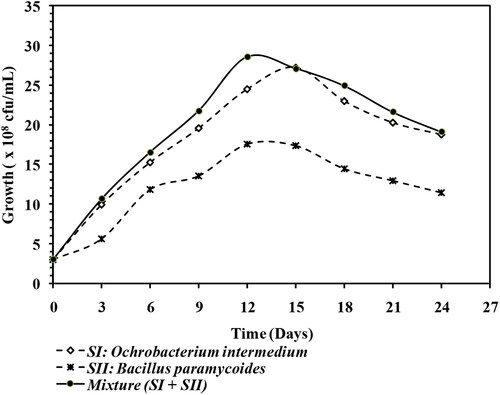
Figure 3. Chromatograms made by GC with mass spectrometry detection (MS) of the n-alkane (C12-C29) residue used engine oil (UEO) hydrocarbon fractions as recovered in hexane extract from culture fluids (Day 24). (A) Control (culture without inoculum); (B) SI: O. intermedium. (C) SII: B. paramycoides, and (D) their mixed consortia (SI + SII inoculated UEO-EMSM) at pH 7.0, 32 °C temperature, 150 rpm. The x axis represents retention time (min).
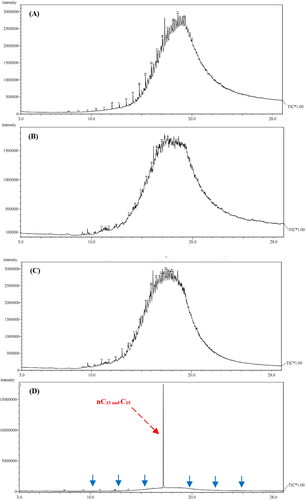
Figure 4. Effect of adsorbent granule numbers (AAC: Alginate-Attapulgite-CaCO3; AC: Alginate-CaCO3) on the removal efficiency (RE %) of UEO (24 h) in soil water extract. (a) Polar mixture and hexane solution and (b) Non-polar solution mixture. Each test was performed in duplicate (n = 2).
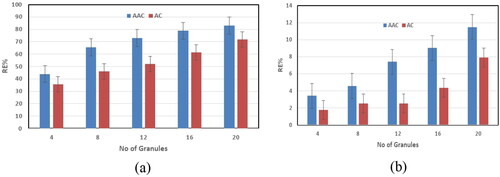
Figure 5. Kinetics of UEO adsorption and removal at 12 h: (A) Zero-order kinetics of the amount of UEO adsorbed per unit mass of AAC, (B) Adsorption capacity (qe) of UEO by AAC beads at equilibrium 12 h.
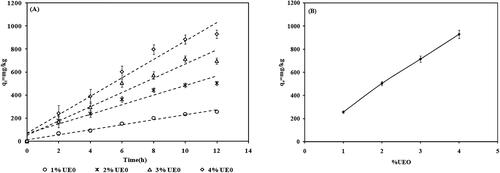
Figure 6. First-order kinetics (A) fitted modeling graph of UEO adsorption and intra-particle diffusion; (B) fitted plots of UEO into AAC.
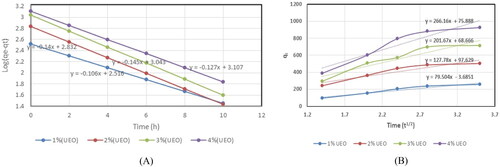
Table 2. Model for fitted data kinetics parameters of AAC-UEO adsorption studies.
Figure 7. Measurements of the diameter of AAC beads (A, B, and D), and the spots on the beads where the bacteria are densely located and growing (C).
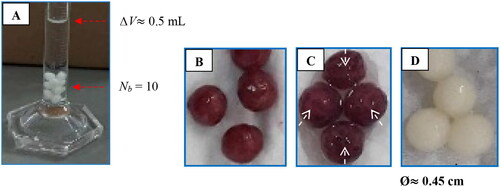
Figure 8. SEM micrographs of AAC immobilized cells after 24 h growth in nutrient broth: O. intermedium (A); mixed culture (B) of O. intermedium LMG 3301LMG 3301 + B. paramycoides MCCC1A04098.
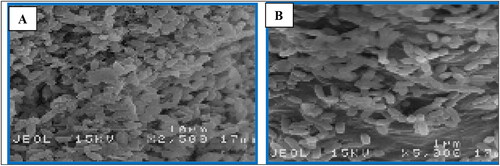
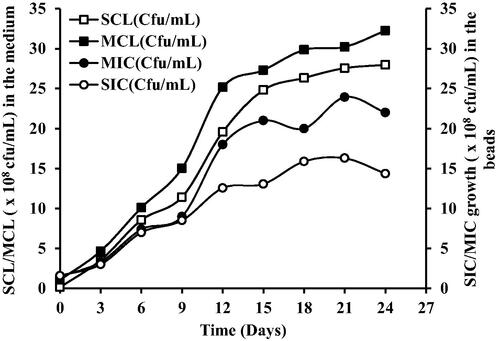
Figure 9. Cell leakage (CL) of single cell (SC) AAC-ICS of O. intermedium LMG 3301LMG 3301 and mixed cell (MC) consortia of O. intermedium LMG 3301LMG 3301 + B. paramycoides MCCC1A04098. SCL: single cell leakage; MCL: mixed cell leakage; ICS: immobilized cell system; AAC: alginate-attapulgite-calcium carbonate; SIC: single immobilized cell; MIC: mixed immobilized cell. Data points represent the mean values of three replicate flasks. Error bars that represent standard deviation were removed for clarity.
Data availability statement
The data that support the findings reported in this study are available at: https://drive.google.com/file/d/1zSt8MYe0scL2hFBE478AWEtI9vb3jAPH/view?usp=sharing, file password: aaaa2014.