
Figures & data
Figure 1. Cytotoxicity and inhibitory effect of H. lupulus crude extract on Vero E6 cells. EC50 for MERS-CoV and SARS-CoV-2.
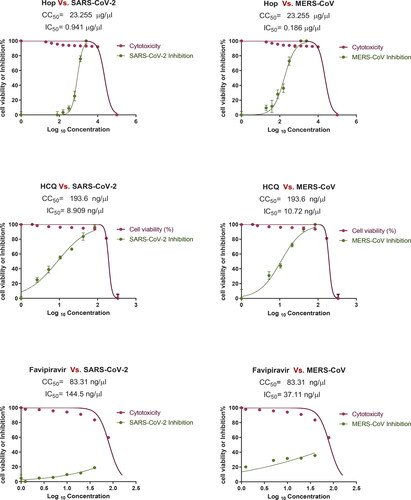
Table 1. Inhibitory effect of Hop extract against MERS-CoV and SARS-CoV-2 in VERO E6 cell line.
Figure 2. Inhibitory effect of Hop extract against MERS-CoV and SARS-CoV-2 by plaque reduction assay.
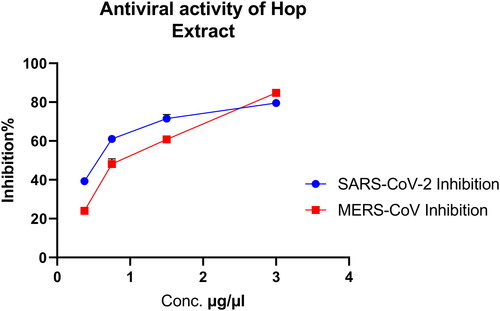
Table 2. Inhibitory effect of Hop extract against MERS-CoV and SARS-CoV-2.
Figure 3. Mechanism of the anti-SARS-CoV-2 activity targeting the viral replication mechanism.
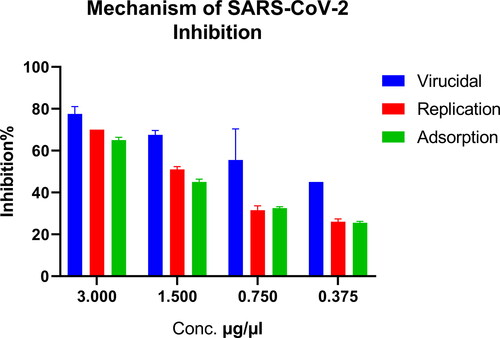
Figure 4. 3 D poses and 2 D intermolecular contact between the top 5 compounds and MERS-CoV RBD. Note: In the 3D figures, the RBD protein is presented as a carton model and the ligands are presented as green sticks, and in the 2D plot, the black ball indicates the carbon atom, the red ball indicates the oxygen atom, the blue ball indicates the nitrogen atom, the red eyelash lines indicate the hydrophobic interaction between ligands and, and the green dashed string indicates the hydrogen bond formed between ligands and the amino acid residues of MERS-CoV RBD.
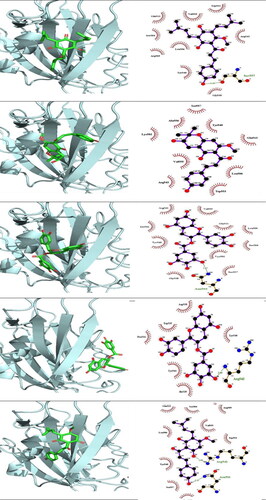
Figure 5. 3 D poses and 2 D intermolecular contact between the top 5 compounds and SARS-CoV 2 RBD. Note: In the 3D figures, the RBD protein is presented as a carton model and the ligands are presented as green sticks, and in the 2D plot, the black ball indicates the carbon atom, the red ball indicates the oxygen atom, the blue ball indicates the nitrogen atom, the red eyelash lines indicate the hydrophobic interaction between ligands and, and the green dashed string indicates the hydrogen bond formed between ligands and the amino acid residues of SARS-CoV 2 RBD.
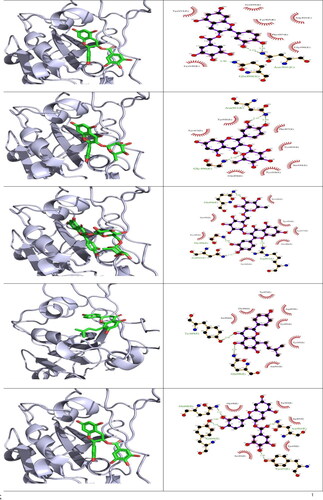
Figure 6. SARS-CoV-2 and MERS-CoV RBD protein multiple sequence alignment.
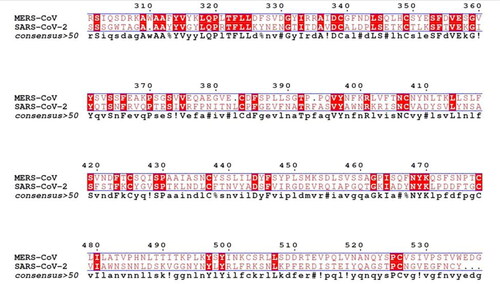
Table 3. Binding affinity, hydrogen bonds and hydrophobic interactions of compounds isolated from H. lupulus docked into SARS-CoV-2 and MERS-CoV RBD protein.
Table 4. Candidate compounds analyzed utilizing the ProTox-II server for their toxicity properties.
Data availability statement
Data sharing not applicable: All data that support the findings reported in this study are available from the corresponding author [T. B.] upon reasonable request.