
Figures & data
Figure 1. Experimental setup with the thermal infrared camera FLIR P640.
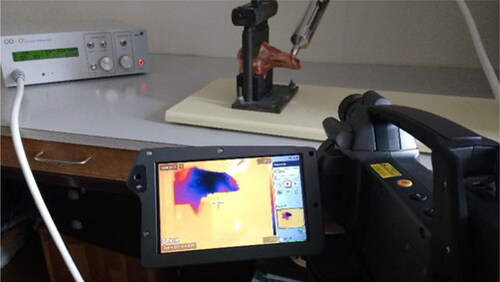
Table 1. Experimental conditions.
Figure 2. Temperature value immediately before drill bit penetration through porcine femur bone. Bx1, box 1 (Max 29.3 °C; Min 17.8 °C; Average 19.6 °C).
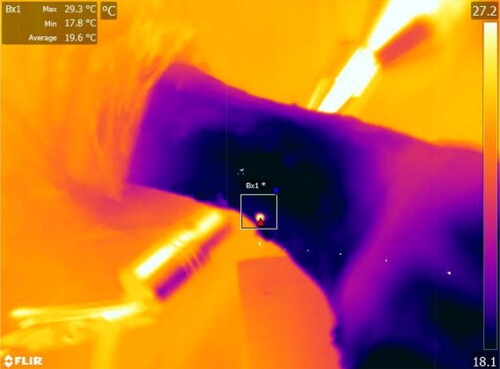
Figure 3. Temperature before capturing the drill bit (29.3 °C).
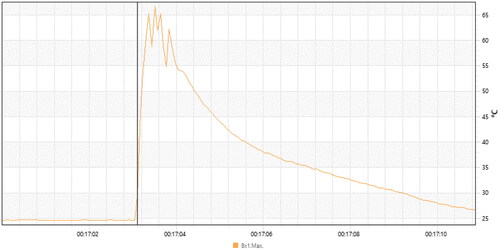
Figure 4. Temperature value immediately after removing the drill bit from the porcine femur bone. Bx1, box 1 (Max 53.7 °C; Min 18.2 °C; Average 23.5 °C).
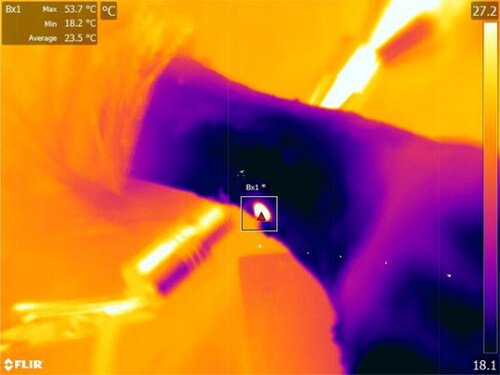
Figure 5. Temperature after removing the drill bit (53.7 °C).
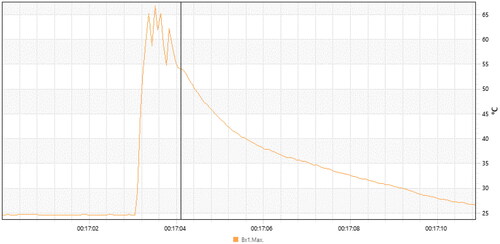
Figure 6. Maximal registered temperature during drilling below the second cortex of porcine femur. Bx1, box 1 (Max 32.7 °C; Min 19.2 °C; Average 23.9 °C). Bx2, box 2 (Max 69.0 °C; Min 19.6 °C; Average 31.3 °C).
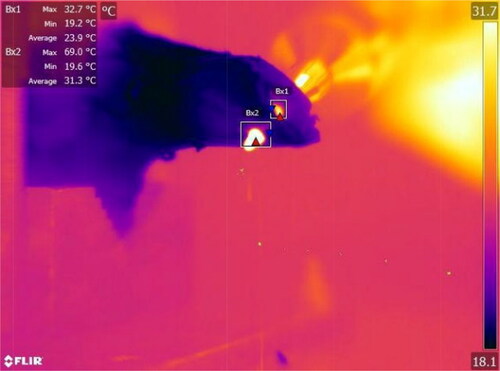
Figure 7. Graph of the temperature in Box 1 (see ).
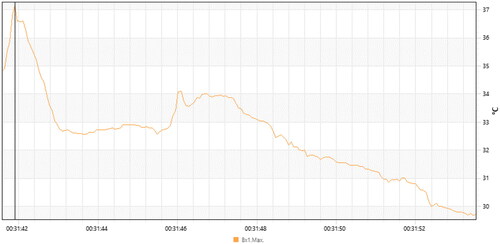
Figure 8. Graph of the temperature in Box 2 (see ). The temperature after removing the drill bit was 57.1 °C.
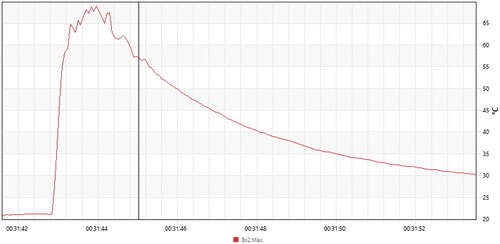
Figure 9. Maximal registered temperature during drilling below the bone wall of bovine femur. Bx1, box 1 (Max 104.5 °C).
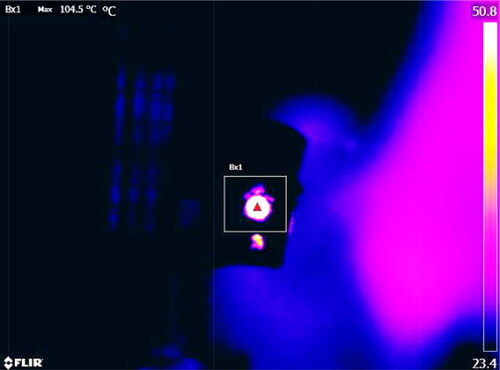
Figure 10. Temperature graph during drilling and after drill bit removal.
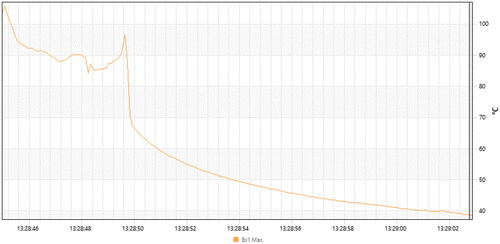
Table 2. Input parameters, their values and possible variations.
Table 3. Possible input parameter values.
Data availability statement
The data that support the findings reported in this study are available from the corresponding author upon reasonable request.