
Figures & data
Figure 1. Experimental set-up, top view (A) and side view (B) for one carousel.
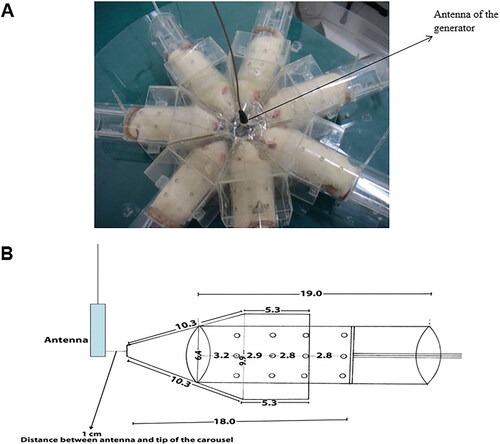
Figure 2. Interstitial space between neurons in right lobes of rats in all groups. RFR groups compared with respect to C-RB group respectively. *p = 0.017, **p < 0.001, ***p < 0.001. C-RB: Sham control-right brain lobes, 900 MHz-RB: 900 MHz-right brain lobes, 1800 MHz-RB: 1800 MHz-right brain lobes, 2100 MHz-RB: 2100 MHz-right brain lobes.
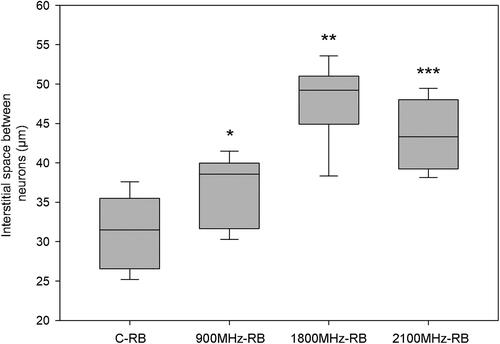
Figure 3. Interstitial space between neurons in left lobes of rats in all groups. RFR groups compared with respect to C-LB group respectively. *p < 0.001, **p = 0.002, ***p < 0.001. C-LB: Sham control-left brain lobes, 900 MHz-LB: 900 MHz- left brain lobes, 1800 MHz-LB: 1800 MHz- left brain lobes, 2100 MHz-LB: 2100 MHz- left brain lobes.
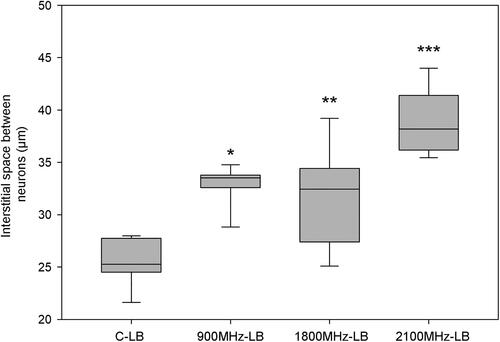
Figure 4. Comparison of the groups for the right and left brain lobes in terms of interstitial space between neurons. Each group was compared for the right and left brain lobes. *p = 0.012, **p = 0.029, ***p < 0.001, ****p = 0.026. C-RB: Sham control-right brain lobes, C-LB: Sham control-left brain lobes, 900 MHz-RB: 900 MHz-right brain lobes, 900 MHz-LB: 900 MHz- left brain lobes, 1800 MHz-RB: 1800 MHz-right brain lobes, 1800 MHz-LB: 1800 MHz- left brain lobes, 2100 MHz-RB: 2100 MHz-right brain lobes, 2100 MHz-LB: 2100 MHz- left brain.
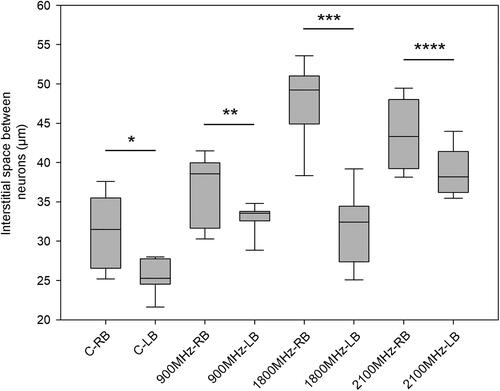
Figure 5. Area of cytoplasm (%) of neurons in the right brain lobes of rats in all groups. RFR groups compared with respect to the C-RB group, respectively. The differences between the groups are non-significant (C-RB vs. 900 MHz-RB p = 0.757; C-RB vs, 1800 MHz-RB p = 0.211; C-RB vs. 2100 MHz-RB p = 0.108). C-RB: Sham control-right brain lobes, 900 MHz-RB: 900 MHz-right brain lobes, 1800 MHz-RB: 1800 MHz-right brain lobes, 2100 MHz-RB: 2100 MHz-right brain lobes.
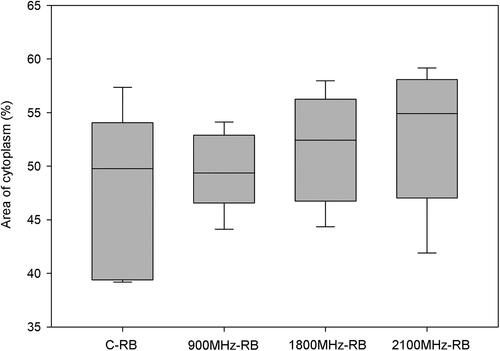
Figure 6. Area of cytoplasm (%) of neurons in the left brain lobes of rats in all groups. RFR groups compared with respect to the C-LB group, respectively. The differences between the groups are non-significant (C-LB vs. 900 MHz-LB p = 0.180; C-LB vs. 1800 MHz-LB p = 0.747; C-LB vs. 2100 MHz-LB p = 0.757). C-LB: Sham control-left brain lobes, 900 MHz-LB: 900 MHz- left brain lobes, 1800 MHz-LB: 1800 MHz- left brain lobes, 2100 MHz-LB: 2100 MHz- left brain lobes.
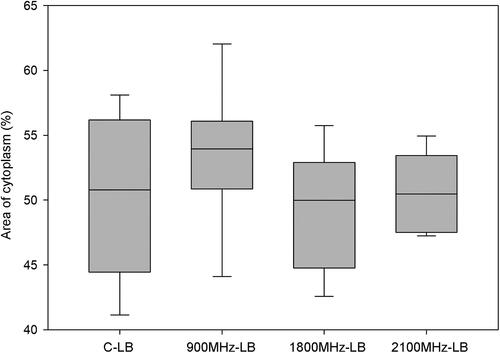
Figure 7. Comparison of the groups for the right and left brain lobes in terms of area of cytoplasm (%) of neurons. Each group was compared for the right and left brain lobe (C-RB vs. C-LB p = 0.475; 900 MHz-RB vs. 900 MHz-LB p = 0.055; 1800 MHz-RB vs. 1800 MHz-LB p = 0.320; 2100 MHz-RB vs. 2100 MHz-LB p = 0.145). C-RB: Sham control-right brain lobes, C-LB: Sham control-left brain lobes, 900 MHz-RB: 900 MHz-right brain lobes, 900 MHz-LB: 900 MHz- left brain lobes, 1800 MHz-RB: 1800 MHz-right brain lobes, 1800 MHz-LB: 1800 MHz- left brain lobes, 2100 MHz-RB: 2100 MHz-right brain lobes, 2100 MHz-LB: 2100 MHz- left brain lobes.
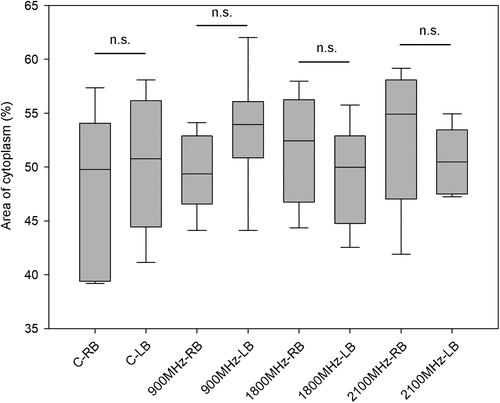
Figure 8. Representative TEM images of the right brain temporal cortex. lobes. Sham control group (A), 900 MHz exposure group (B), 1800 MHz exposure group (C), 2100 MHz exposure group (D). Scale bars = 10 µm (A, B, C, D).
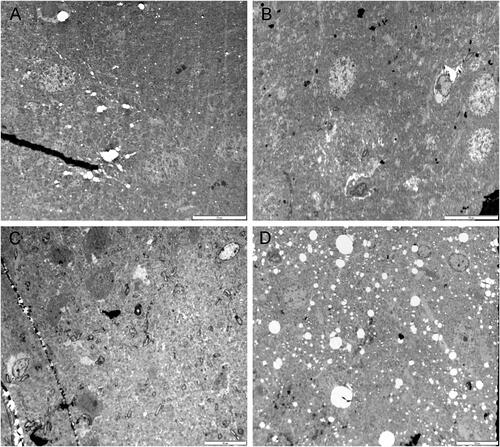
Figure 9. Representative TEM images of the left brain temporal cortex. Sham control group (A), 900 MHz exposure group (B), 1800 MHz exposure group (C), 2100 MHz exposure group (D). Scale bars = A:5 µm (A); 10 µm (B, C, D).
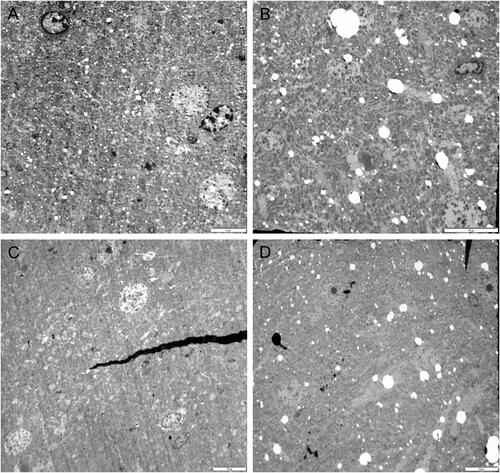
Table 1. Right brain neuron and cytoplasm areas of the groups.
Table 2. Left brain neuron and cytoplasm areas.