
Figures & data
Figure 1. Workflow for genome/transcriptome-mining of cyclotides. This workflow shows the main steps which were divided into two main approaches as follows: 1) In silico approach (involving retrieval of genomes/transcriptomes and cyclotide sequences, cyclotide sequence alignment, primer design, in silico mining analysis, data visualization and statistical analysis), 2) In vitro approach (involving DNA isolation, PCR amplification and data analysis).
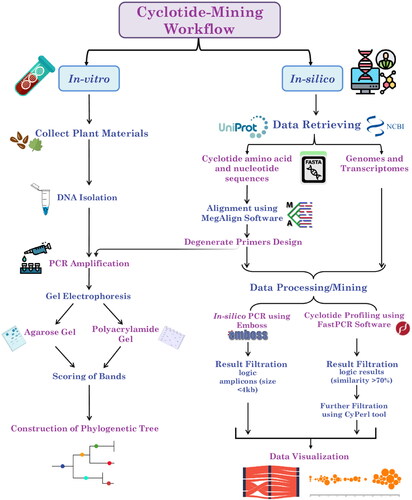
Figure 2. Alluvial diagrams showing the in silico PCR results (logic results < 4 kb) of Bracelet, Moebius, Trypsin Inhibitors, and Hybrid primers against different plant types at a 10% mismatch percentage. Diagram (a) shows the number of amplicons/subfamily in each plant genome, and Diagram (b) shows the number of amplicons/subfamily in each plant transcriptome.
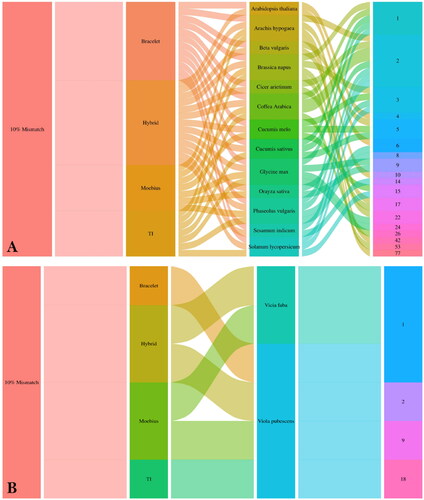
Figure 3. Correlation coefficient plot showing the correlation between cyclotide subfamilies and genome size based on the in silico PCR results. Hybrid subfamily showed the highest positive correlation with genome size at P-value < 0.05 with r-values ranging from −0.24 to 0.94.
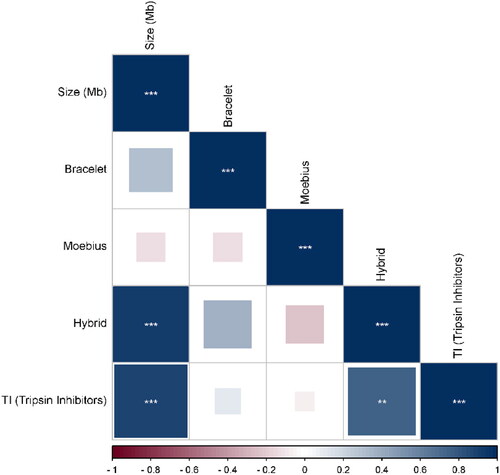
Figure 4. Beesworm plot shows the cyclotide profiling results (number of similarities > 70%) of each primer of Bracelet, Moebius, Trypsin Inhibitors and Hybrid primer pairs against 15 plant species.
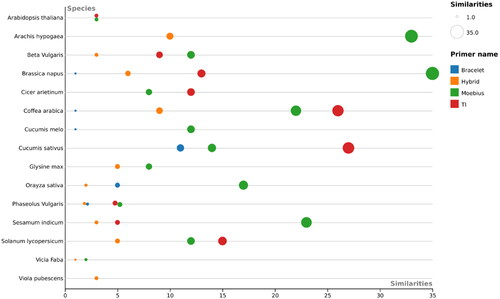
Figure 5. Diagram showing the principle of Cyclotide Subfamily-Specific (CSS) PCR-based markers and their capability to differentiate between close genotypes based on the prevalence of cyclotide mature domains (CMDs) for a certain subfamily, and distances between two adjacent CMDs.
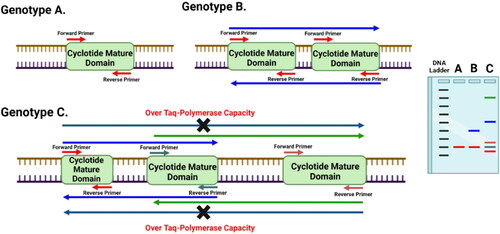
Figure 6. Acrylamide gels used in screening of cyclotides and their analogues using cyclotide sub-family specific primers (Bracelet, Hybrid and Trypsin Inhibitors) in different economic plant species: Tomato ‘Solanum lycopersicum’ (T.CV1: LOJAIN, T.CV2: L-276, and T.CV3: 023), Cucumber ‘Cucumis sativus’ (C.CV1: AL NEMS F1, C.CV2: Ruba 73 F1, and C.CV3: OF OFFICER F1), Rice ‘Oryza sativa’ (R.CV1: SK-102, R.CV2: SK-103, and R.CV3: SK-106), Sesame ‘Sesamum indicum’ (S.CV1: Sohag-1, S.CV2: Toshky-1, and S.CV3: Shandwil-3), Wheat ‘Triticum aestivum’ (T.CV1: Bany Swif-4, T.CV2: Gemmeiza-1, and T.CV3: Sakha 95), Faba bean ‘Vicia faba’ (F.CV1: Wadi 1, F.CV2: Nobaria 1, and F.CV3: Nobaria 3), and Viola tricolor.
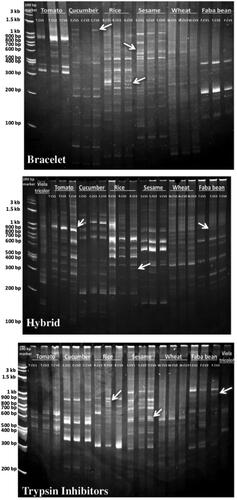
Table 1. Primers and marker efficiency parameters of designed cyclotide primers.
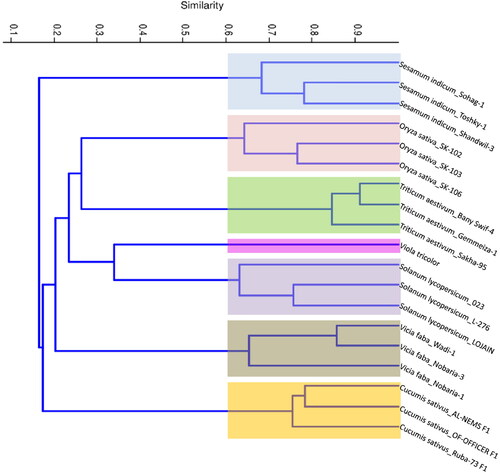
Figure 7. Phylogenetic tree showing the similarity among seven different plant species and their cultivars/genotypes based on Jaccard’s similarity of Bracelet, Hybrid and TI cyclotide combined data.
Supplemental Material
Download Zip (1.4 MB)Data availability statement
The authors agree to make data and materials supporting the results or analyses presented in their paper available upon reasonable request.