
Figures & data
Figure 1. Scheme of simulated gastrointestinal digestion model involving simulated gastric fluid and simulated intestinal fluid and performed analysis.
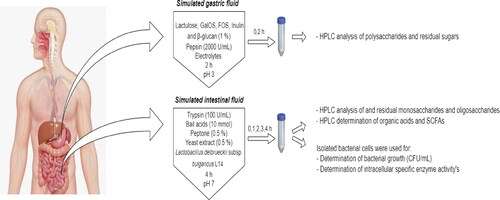
Figure 2. Degree of the hydrolysis of studied prebiotic oligosaccharides and polysaccharides in conditions simulating gastric fluid after period of 2 h (1% lactulose (A), 1% GalOS (B), 1% FOS (C), 1% inulin (D), and 1% β-glucan (E)).
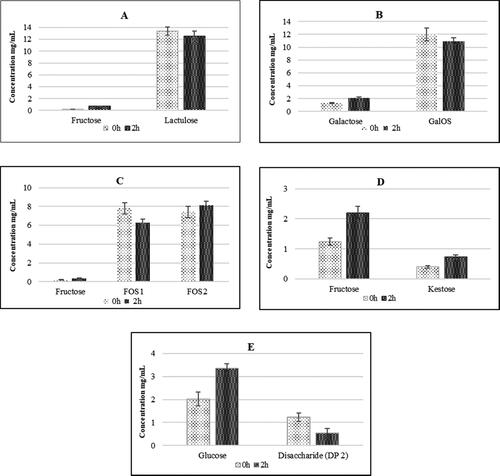
Table 1. Residual oligosaccharide concentrations and percent of their hydrolysis obtained after 1% lactulose, GalOS and FOS fermentation in conditions simulating SIF in the presence of Lb. delbrueckii subsp. bulgaricus L14.*
Table 2. Residual monosaccharide concentrations obtained after 1% lactulose, GalOS and FOS fermentation in conditions simulating SIF in the presence of Lb. delbrueckii subsp. bulgaricus L14.*.
Table 3. Residual monosaccharide and oligosaccharide concentrations obtained after 1% inulin and β-glucan fermentation in conditions simulating SIF in the presence of Lb. delbrueckii subsp. bulgaricus L14.*
Figure 3. Dynamics of cell growth of Lb. delbrueckii subsp. bulgaricus L14 strain, in the presence of different oligosaccharides in conditions simulating the small intestine fluid.
*Values are means of three measurements ± SD.
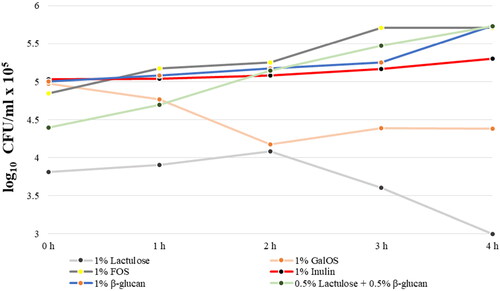
Table 4. Dynamics of changes in the specific activity of the enzymes from Lb. delbrueckii subsp. bulgaricus L14 in the presence of different oligosaccharides in conditions simulating the SIF.*
Table 5. Organic and short-chain fatty acids concentrations obtained after utilization of different oligosaccharides in conditions simulating SIF in the presence of Lb. delbrueckii subsp. bulgaricus L14.
Data availability statement
All data that support the findings reported in this study are available from the corresponding author upon reasonable request.