
Figures & data
Table 1. Distribution of cases.
Figure 1. Distribution by age in the group of malignant eyelid tumours (N = 450).
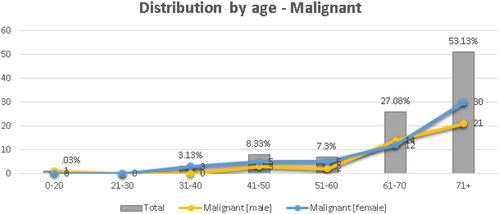
Figure 2. Distribution by size and type of malignant, benignant eyelid tumours and inflammations (N = 450).
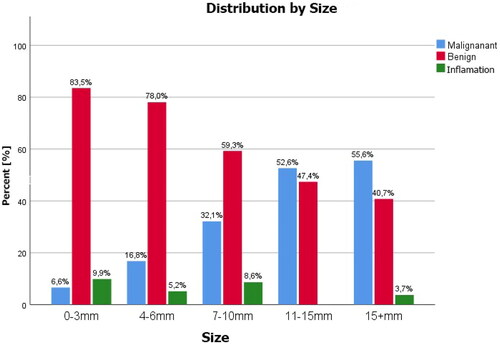
Figure 3. Percentage distribution of the most common eyelid malignant tumours by age – BCC-Basal cell carcinoma, SCC – squamous cell carcinoma, SGC – sebaceous gland carcionoma, (N = 450).
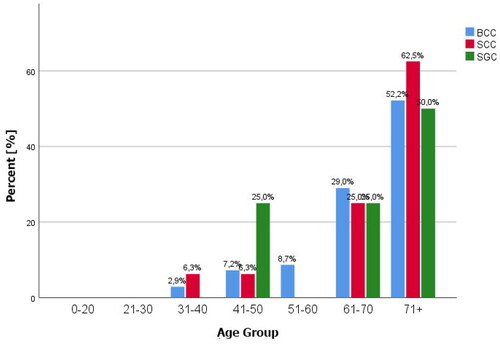
Figure 4. Distribution of histological types of basal cell carcinoma (BCC) on eyelids (N = 76).
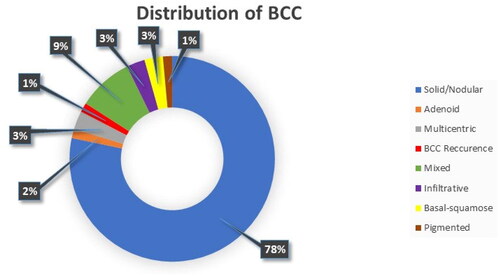
Figure 5. Distribution of mean age (57.4 years) in the three eyelid tumour categories – Malingnant, benignant and inflammation (N = 450).
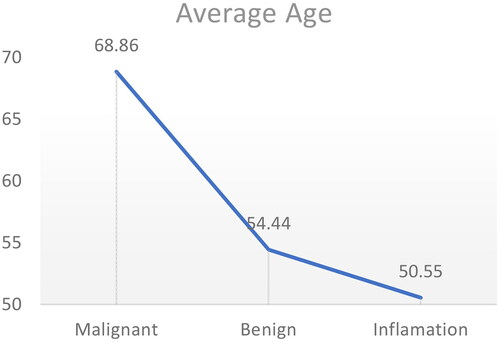
Figure 6. Disease duration – within-group analysis of prevalence/malignancy (p < 0.009).
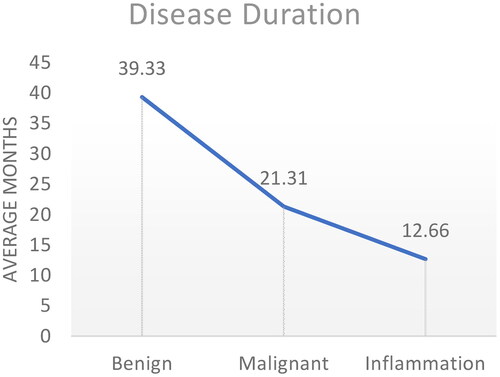
Figure 7. Average size in the three groups of eyelid tumours (p < 0.0001).
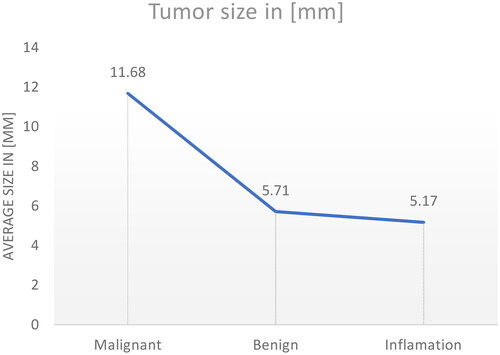
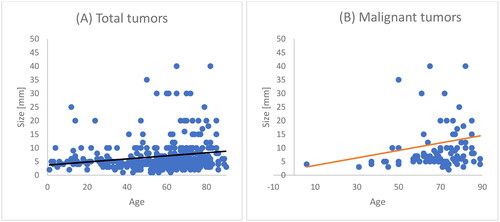
Figure 8. Correlation analysis by age and size (p < 0.01, r = 0.012). A/Total eyelid tumours, B/Malignant eyelid tumours.
Availability of data and materials
Data are available on request due to privacy or other restrictions.