
Figures & data
Table 1. Primer sequences used for real-time quantitative reverse transcriptase polymerase chain reaction (qRT-PCR).
Table 2. Biochemical serum parameters from control and treated rats.
Figure 1. Real-time RT-PCR analysis of IL-6 and TNF-α mRNA in liver (A, B) and kidney (C, D) from control and treated rats. Values are presented as ratio fold change of mRNA to control group. Data are mean ± SEM. *p < 0.05, **p < 0.01 versus CTRL; ≠ p < 0.05, ≠ ≠ p < 0.01 versus DM. CTRL: control group, DM: Alloxan-induced diabetic rats, UCMS: unpredictable chronic mild stress group, DM + UCMS: combined group.
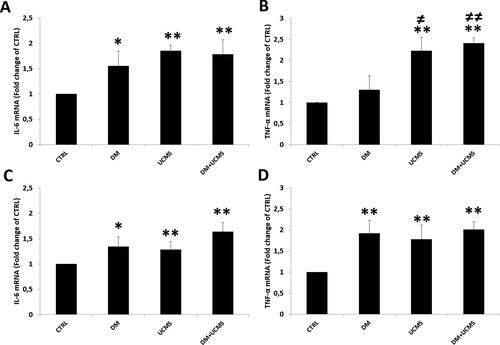
Figure 2. Levels of proinflammatory cytokines, IL-6 and TNF-α in liver (A, B) and kidney (C, D) determined by ELISA. Data are mean ± SEM. *p < 0.05, **p < 0.01 versus CTRL; ≠ ≠ p < 0.01 versus DM; # p < 0.05, ## p < 0.01 versus UCMS. CTRL: control group, DM: Alloxan-induced diabetic rats, UCMS: unpredictable chronic mild stress group, DM + UCMS: combined group.
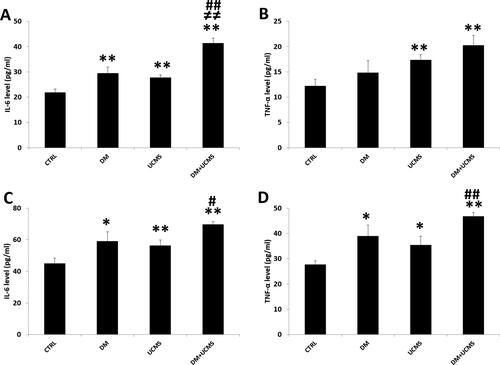
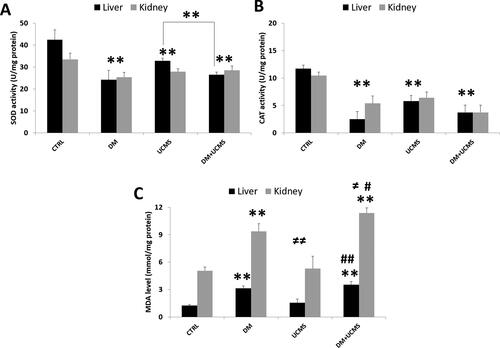
Figure 3. Antioxidant enzymes activities, SOD (A), CAT (B) and MDA level (C) in liver and kidney from control and treated rats. Data are mean ± SEM. **p < 0.01 versus CTRL; ≠ ≠ p < 0.01 versus DM; # p < 0.05, ## p < 0.01 versus UCMS. CTRL: control group, DM: Alloxan-induced diabetic rats, UCMS: unpredictable chronic mild stress group, DM + UCMS: combined group.
Data availability statement
The data that support the findings of this study are available at from the corresponding author, upon reasonable request.