
Figures & data
Table 1. Absolute counts and proportions of lymphocytes and lymphocytes subset in the studied groups (mean ± SD).
Figure 1. Expression of β-Klotho on total CD3+ (A, circles), CD4+ (B, triangles) and CD8+ (C, diamonds) T-cells in healthy subjects. Group A: young adults (open symbols); group B: middle-aged adults (light grey symbols) and group C: elderly (dark grey symbols); ***p < 0.001; **p < 0.01; *p < 0.05; ns, not significant, p > 0.05. Means ± SD are denoted. Comparisons between groups were done by using non-parametric Kruskal–Wallis ANOVA rank tests, followed by post-hoc group pairwise comparisons, with p-value adjustment for multiple comparisons using Dunn’s test.
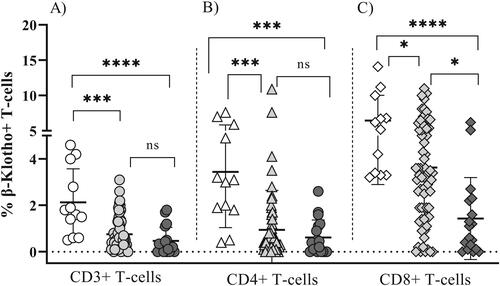
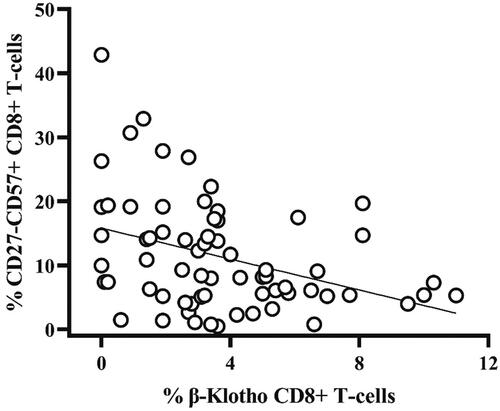
Figure 2. Inverse correlation between the share of β-Klotho + CD8+ T-lymphocytes and CD27-CD57+ CD8 + T-cells in group B (middle-aged adults) (rho = −0.4, p < 0.01). Correlations were evaluated with Spearman’s rank correlation test.
Data availability statement
The data that support the findings of this study are available from the corresponding author (YT), upon reasonable request.