
Figures & data
Figure 1. Overview of the image data during the consecutive processing stages: fibre image after the pre-processing stage (A); separated foreground after the greyscale segmentation (B); skeletons remaining after the thinning process (C); detected fibres after post-processing and feature extraction (D).
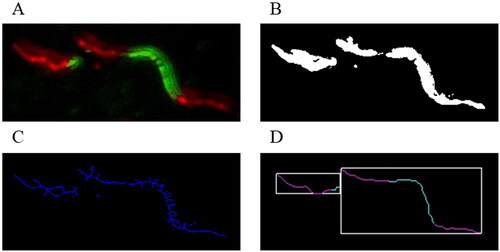
Figure 2. Description of the orientation check technique. A is the currently traversed pixel, B is the pixel from which A was reached during the traversal and C is the pixel that is checked whether it is reachable. The current turning angle to reach C is represented with α. “α max” is the maximum turning degree. C must lie in the area of the angle A1AA2 in order to be traversed.
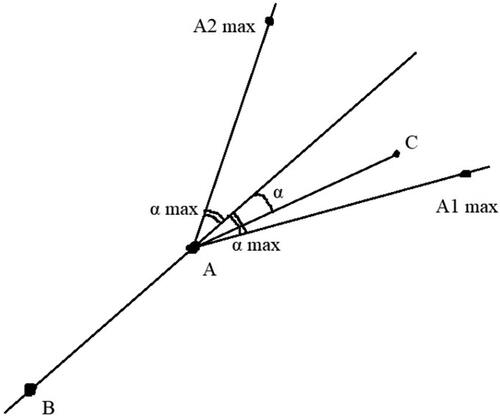
Figure 3. An image of the graphical user interface of the “DNA size finder”.
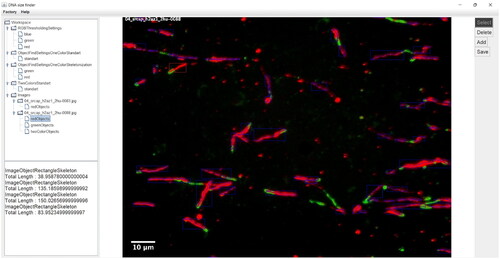
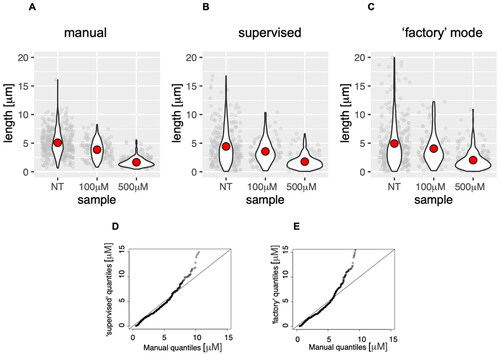
Figure 4. Analysis of DNA fibres (length of the second label) obtained from cells treated with the indicated concentration of HU, subjected to manual analysis (A), or analysis by the DNA size finder in user-supervised (B) and fully automated modes (C). The red dot on violin plots indicates the mean of all measurements (plotted in grey behind the violin plots). Q-Q plots of data distributions produced by DNA size finder in supervised (D) and automated ‘factory’ mode (E).
Data availability statement
The application is free to use and can be accessed at the following link: https://github.com/Teodor03/DNA-size-finder