
Figures & data
Table 1. Average RMSD ()/SASA (
) per molecule of N501[Y, T, S] heterodimers.
Figure 1. Backbone deviation analysis of N501[Y, T, S] hetero dimers (Gromacs gmx rms program).
![Figure 1. Backbone deviation analysis of N501[Y, T, S] hetero dimers (Gromacs gmx rms program).](/cms/asset/28f41463-1897-400e-9acb-a027138b2fcd/tbeq_a_2206492_f0001_c.jpg)
Figure 2. Solubility analysis of N501[Y, T, S] hetero dimers (Gromacs gmx sasa program).
![Figure 2. Solubility analysis of N501[Y, T, S] hetero dimers (Gromacs gmx sasa program).](/cms/asset/1c97006a-4524-454d-b003-b90c8417bdc6/tbeq_a_2206492_f0002_c.jpg)
Figure 3. Mean fluctuation per residue (S-protein RBD) (Gromacs gmx rmsf program).
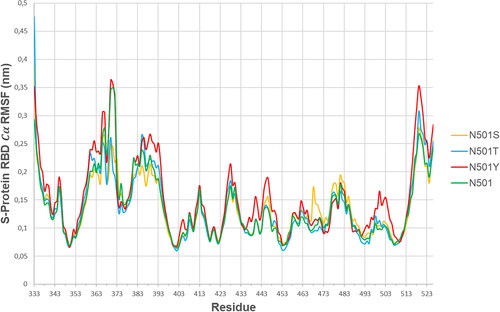
Table 2. S-Protein RBD domain [499-505]: ProThrAsn(Tyr)GlyValGlyTyr RMSF analysis.
Figure 4. S-protein RBD secondary structure prediction (Gromacs gmx do_dssp module).
Note: Time is plotted on the horizontal axis (0–50 ns), while S-protein RBD residues in the range of 1–194 are shown on the vertical axis.
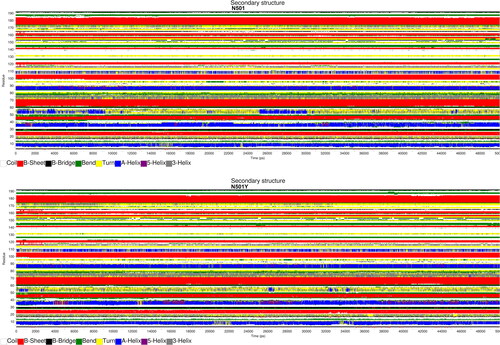
Table 3. Secondary structure assessment.
Figure 5. Hydrogen bonds dynamics in N501 and N501Y hetero dimers (Gromacs gmx hbond program).
Note: red, number of intermolecular hydrogen bonds in N501Y complex during [0–50] ns MD simulation; green, number of intermolecular hydrogen bonds in N501 complex during [0–50] ns MD simulation.
![Figure 5. Hydrogen bonds dynamics in N501 and N501Y hetero dimers (Gromacs gmx hbond program).Note: red, number of intermolecular hydrogen bonds in N501Y complex during [0–50] ns MD simulation; green, number of intermolecular hydrogen bonds in N501 complex during [0–50] ns MD simulation.](/cms/asset/f4867074-e632-4da4-97ec-defb2cd64eb8/tbeq_a_2206492_f0005_c.jpg)
Table 4. Average number of hydrogen bonds formed in [0–50] ns, wild-type or mutant S-protein RBD [499-505]: ProThrAsn(Tyr)GlyValGlyTyr.
Table 5. S-protein RBD [499-505]: ProThrAsnGlyValGlyTyr–hACE2 hydrogen bonds dynamics in wild type N501.
Table 6. S-protein RBD [499-505]: ProThrTyrGlyValGlyTyr–hACE2 hydrogen bonds dynamics in mutant N501Y.
Figure 6. Visualization of hydrogen bonds between hACE2 and SARS-CoV-2 spike protein – N501 against N501Y heterodimer drawn in PyMol molecular graphics program.
Note: red, high occupancy of a hydrogen bond; yellow, average occupancy of a hydrogen bond.
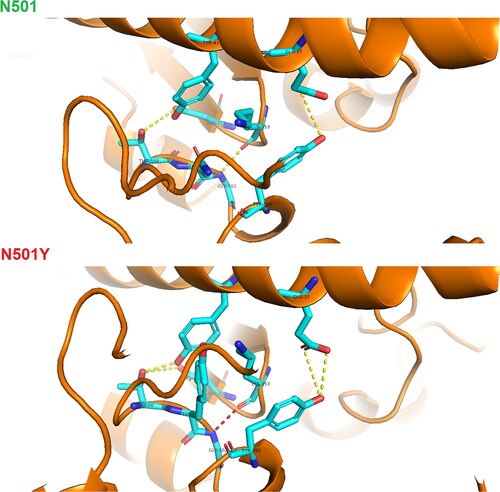
Table 7. energy (kcal/mol) in N501 and N501Y heterodimers.
Supplemental Material
Download Zip (4.7 MB)Data availability
The data that support the findings reported in this paper are available in the Appendix files: RMSD_analysis.xlsx; RMSF_analysis.xlsx; SASA_analysis.xlsx; H_bonds_analysis.xlsx; Gly502_Lys353_H-bond_Energy.xlsx