Figures & data
Table 1. Laboratory parameters in patients and controls (on average ± standard deviation).
Table 2. List of investigated bacteria.
Figure 1. Significantly lower amount of Eubacterium spp. in T2DM patients compared to controls in groups with low 25(OH)D levels (p = 0.023).
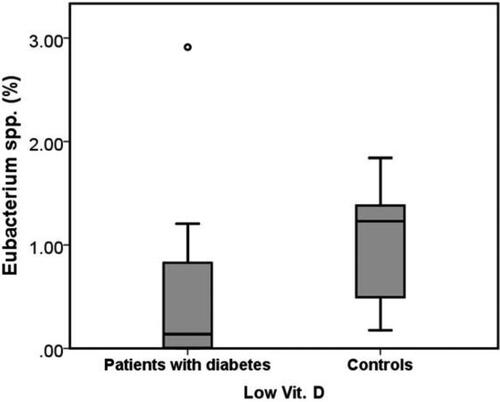
Figure 2. Amount of Enterobacter spp. and Bilophila wadsworthia in T2DM patients and controls.
Asterisks indicate statistically significant differences (p < 0.05).
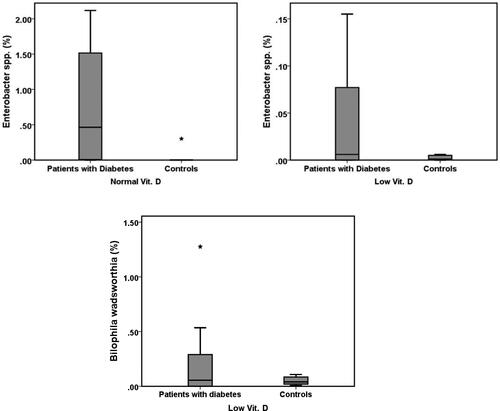
Figure 3. Increase in the amount of Escherichia spp. and Pseudomonas spp. in patients with T2DM compared to controls in groups with low Vitamin D levels.
Asterisks indicate statistically significant differences (p < 0.05).
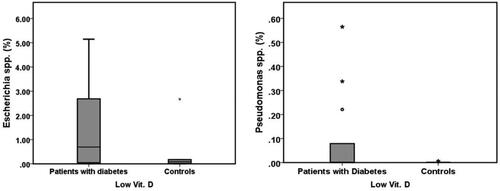
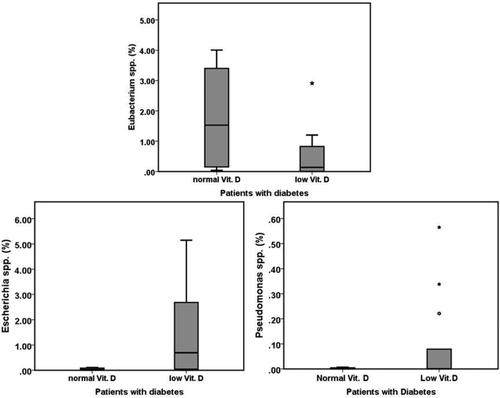
Figure 4. Increase in Eubacterium spp. and decrease in Escherichia spp. and Pseudomonas spp. with the normalization of 25(OH)D levels.
Asterisks indicate statistically significant differences (p < 0.05).