
Figures & data
Table 1. Distribution of cases by age and gender.
Table 2. Distribution of cases by checkup.
Table 3. Average values of keratometric indicators.
Table 4. Average values of biometric indicators.
Figure 1. Relative proportion of eyes with AE < 0.50D, AE > 0.50D and befCylD value.
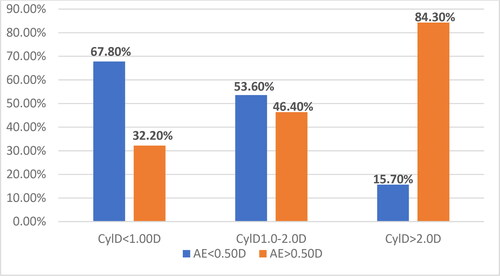
Table 5. Relative risk of refractive error according to befCyl D value.
Table 6. Inspection of the distributions in the two groups.
Figure 2. Relative proportion of eyes with AE < 0.50D and AE > 0.50D in AL subgroups.
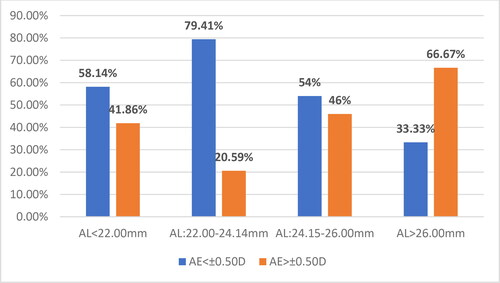
Figure 3. Distribution according to AL and refractive formula in eyes with AE< ±0.50D.
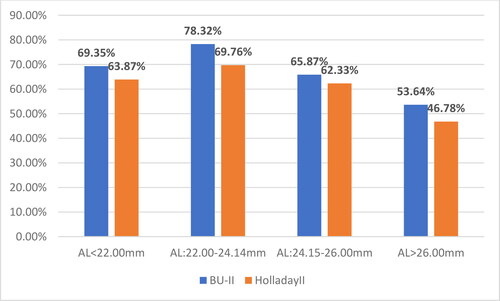
Figure 4. Relative share of eyes with UCVA.
Note: All the 235 eyes were taken as 100%.
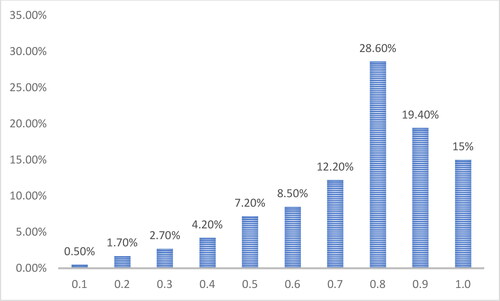
Figure 5. Relative share of eyes under UCVA, according to the applied formula.
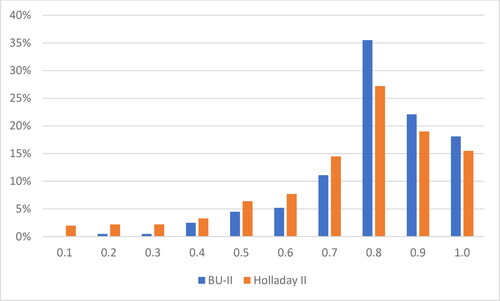
Figure 6. Relative share of eyes with UCVA > 0.8 according to AL and the refractive formula.
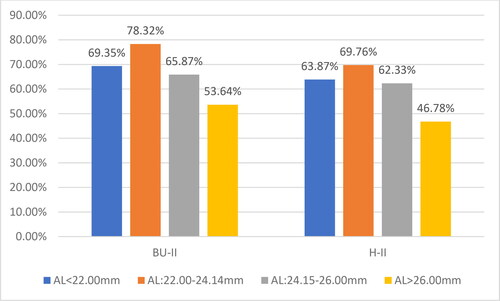
Table 7. Relationship between AL and choice of refractive formula.
Data availability
The data that support the findings reported in this study are available from the corresponding author [T.K.] upon reasonable request. The data are not publicly available due to their containing information that could compromise the privacy of research participants.