
Figures & data
Figure 1. Body weight gain and intestinal morphological features of mice with and without sodium phytate intake. (A) Body weight gain of mice in the Ctrl, the phyA-L and the phyA-H group. Data are presented as means with SD (n = 10 for each group). (**p < .01, ***p < .001). (B) Representative colonic sections stained by hematoxylin and eosin (HE). Scale bar, 100 μm. Note: 4-week-old male Kunming mice were orally gavaged with 100 μL saline (Ctrl, Control) or 100 μL saline containing 8 mg (phyA-L, low phyate) or 40 mg of sodium phytate (phyA-H, high phyate) per day for 4 weeks.
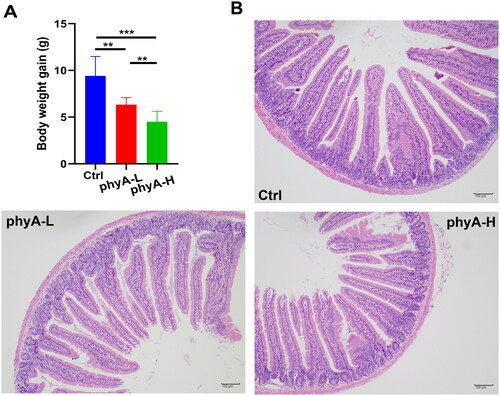
Figure 2. Rarefaction analysis and OTU numbers in the gut microbial community of mice with and without sodium phytate intake. (A) Rarefaction curves of OTUs in different samples from the Ctrl, the phyA-L and the phyA-H group. Sample richness in each sample is expressed by Sobs index, which is calculated with the Mothur software (v.1.30.1). The curves were generated by plotting the valid sequence numbers obtained in each sample against the richness estimator Sobs index. (B) Venn diagrams of OTU numbers in the Ctrl, the phyA-L and the phyA-H group. The diagram was generated with R software package. The unique and shared OTUs numbers among the three groups are shown. 4-week-old male Kunming mice were orally gavaged with 100 μL saline (Ctrl, Control) or 100 μL saline containing 8 mg (phyA-L, low phyate) or 40 mg of sodium phytate (phyA-H, high phyate) per day for 4 weeks.
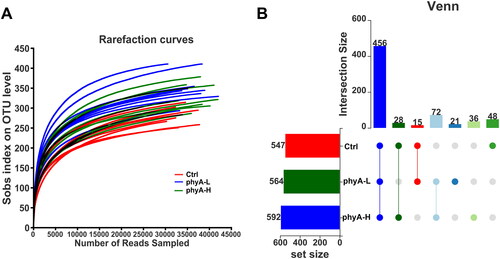
Figure 3. Diversity analysis of gut microbiome of mice with and without sodium phytate intake. (A) The α-diversity analysis of gut microbiome of mice in the Ctrl, the phyA-L and the phyA-H group. The Shannon, Simpson, ACE, Chao and Sobs indices reflecting species diversity and richness were determined and compared with the Mothur software (v.1.30.1). Data are presented as means with SD (*p < .05, **p < .01, ***p < .001). (B) PCoA analysis of the gut microbiome of mice in the Ctrl, the phyA-L and the phyA-H group. PC1 and PC2 explained 26.11% and 20.27% of the variance, respectively. A symbol in the plot represents a sample. The discrete degree of PC1 is shown in the right panel. Data were analyzed with QIIME 2 software, and the diagrams were generated with R software package. Note: 4-week-old male Kunming mice were orally gavaged with 100 μL saline (Ctrl, Control) or 100 μL saline containing 8 mg (phyA-L, low phyate) or 40 mg of sodium phytate (phyA-H, high phyate) per day for 4 weeks.
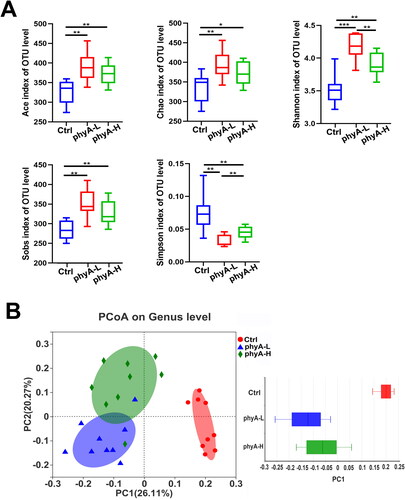
Figure 4. Compositions of the gut microbiome of mice with and without sodium phytate intake. (A) Column diagrams of dominant bacterial phyla. (B) Comparation of the significantly altered phyla. (C) Bacteroidetes/Firmicutes (B/F) ratio. (D) Relative abundance of the most dominant genera. The size of the dots represents the relative abundance of each genus in the sample. The diagrams were generated using R software with stats package. Data are presented as means with SD (n = 9 for each group). (*p < .05, **p < .01). 4-week-old male Kunming mice were orally gavaged with 100 μL saline (Ctrl, Control) or 100 μL saline containing 8 mg (phyA-L, low phyate) or 40 mg of sodium phytate (phyA-H, high phyate) per day for 4 weeks.
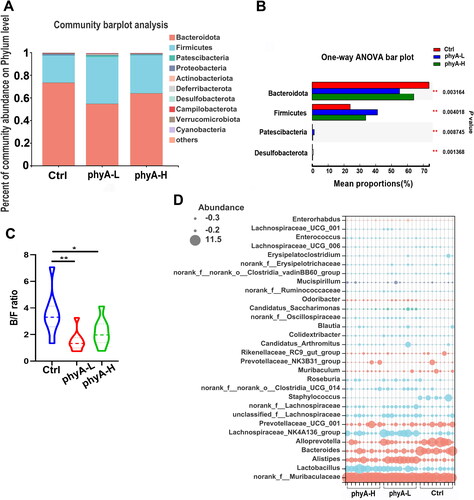
Figure 5. Ternary and LEfSe analysis of the gut microbiome of mice with and without sodium phytate intake. (A) A ternary plot reflects the dominant genera in the three groups. The diagram was generated using GGTERN server (http://www.ggtern.com/). (B) LDA effect size (LEfSe) analysis of the gut microbiome in the three groups. (C) LDA score in the three groups. The altered abundant taxa with a score > 4 in the gut microbiome in the Ctrl, the phyA-L and the phyA-H group are shown in the histogram. LEfSe analysis was performed using the online LEfSe server (http://huttenhower.sph.harvard.edu/galaxy/root?tool_id=lefse_upload). 4-week-old male Kunming mice were orally gavaged with 100 μL saline (Ctrl, Control) or 100 μL saline containing 8 mg (phyA-L, low phyate) or 40 mg of sodium phytate (phyA-H, high phyate) per day for 4 weeks.
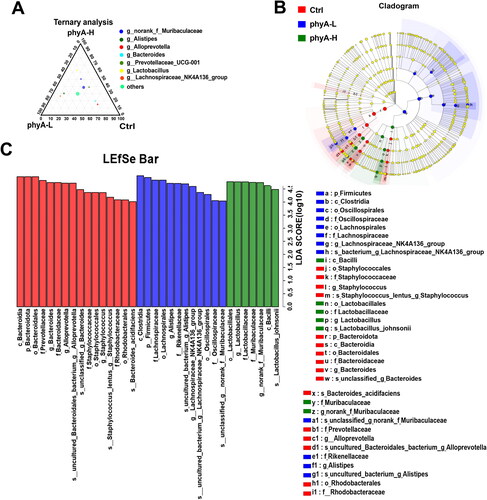
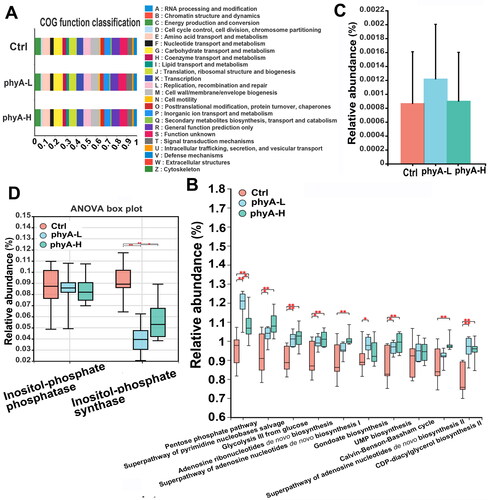
Figure 6. Functional changes of the gut microbiome of mice with and without sodium phytate intake. (A) COG functional classification analysis of the gut microbiome in the three groups. (B) The top metabolic pathways altered in the gut microbiome in the three groups. (C) Relative abundance of phytase-producing microorganisms in the three groups. (D) The relative abundances of inositol-phosphate phosphatase and inositol-phosphate synthase in the three groups. The relative abundance of microorganisms producing specific enzymes and the involved metabolic pathways were predicted with PICRUSt2 software package by mapping the gut microbial information against the KEGG database. Data are presented as means with SD (*p < .05, **p < .01, ***p < .001). 4-week-old male Kunming mice were orally gavaged with 100 μL saline (Ctrl, Control) or 100 μL saline containing 8 mg (phyA-L, low phyate) or 40 mg of sodium phytate (phyA-H, high phyate) per day for 4 weeks.
Supplemental Material
Download PDF (612.9 KB)Data availability statement
All data are available from the corresponding author upon reasonable request. The datasets involved in this study were deposited in the National Center for Biotechnology Information database with accession no. PRJNA884098 (https://www.ncbi.nlm.nih.gov/bioproject/?term=PRJNA884098).