Figures & data
Figure 1. Representative example of oligo-dT anchored cDNA-SRAP analysis with three different SRAP primers (ME3, ME4 and ME5) during RAF: recovery after freezing-induced desiccation in H. rhodopensis. D: freezing desiccated state; ER: early recovery (1 + 3 h); LR: late recovery (24 h + 7 d); M: 100 bp Plus™; arrows indicate the differentially expressed bands that were selected for reamplification and sequencing.
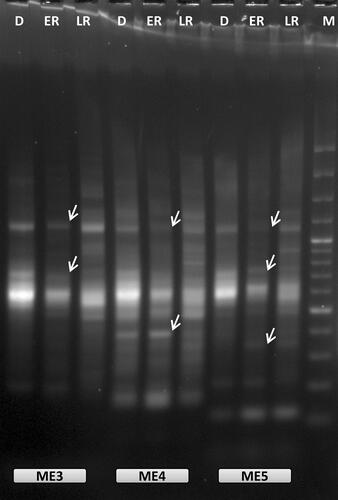
Figure 2. Examples of oligo-dT anchored cDNA-SCoT analysis with five different SCoT primers (SCoT1, SCoT2, SCoT8, SCoT9 and SCoT13) during RAF in H. rhodopensis. D: freezing desiccated state; ER: early recovery (1 + 3 h); LR: late recovery (24 h + 7 d); NTC: PCR reaction without cDNA; M: 100 bp Plus™; arrows indicate the differentially expressed bands that were selected for reamplification and sequencing.
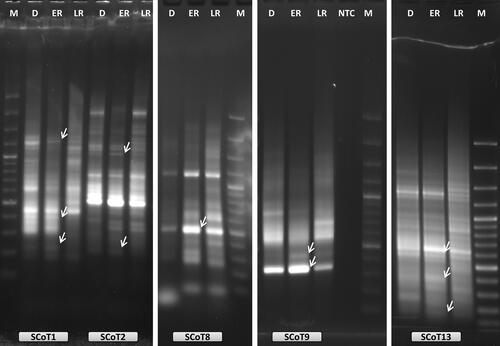
Table 1. Homology analysis of the selected differentially expressed TDFs to gene sequences in the NCBI non-redundant protein database using the BLASTX algorithm.
Figure 3. qRT-PCR analysis of the expression of 10 TDFs during early and late recovery stages of H. rhodopensis. D: freezing desiccated state; ER: early recovery (1 + 3 h); LR: late recovery (24 h + 7 d). Error bars on each column represent the SD of three replicates.
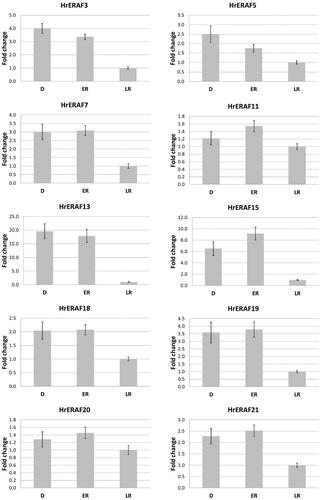
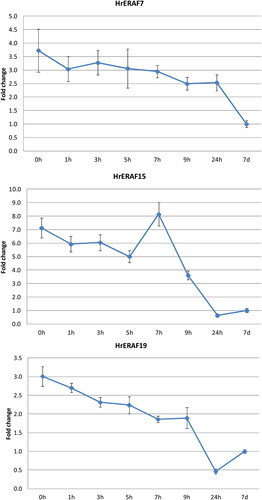
Figure 4. qRT-PCR expression analysis of three selected TDFs during the full course of H. rhodopensis RAF. 0 h: freezing desiccated state (8% RWC); 1, 3, 5, 7, 9, 24 h, 7 d: hours (days) after rewatering. Error bars on each column represent the SD of three replicates.