
Figures & data
Figure 1. Changes in SOD (A), POD (B) and CAT (C) activity (U·mg−1 fresh weight) in leaves and roots of common bean varieties ‘WZWJD’ and ‘HZYTJ’ during 10% PEG-simulated drought stress and rewatering. Samples (leaves and roots) were collected at three time points, specifically, when untreated (0 h), when wilting after treatment (6 h after treatment), and after transfer to 1/2 Hoagland solution rehydration treatment (12 h after transfer). Error bars are standard errors of the mean from three biological replicates. The different letters indicate significant differences at p < 0.05 (student’s t-test).
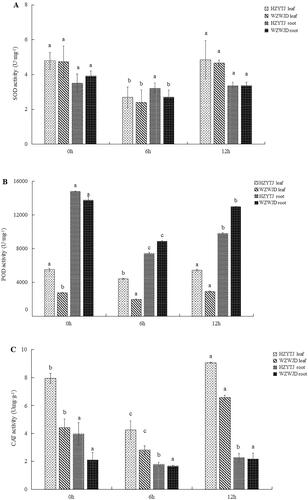
Figure 2. Changes in soluble protein (A) and sugar (B) in leaves and roots of common bean varieties ‘WZWJD’ and ‘HZYTJ’ during 10% PEG-simulated drought stress and rewatering. Samples (leaves and roots) were collected at three time points, specifically, when untreated (0 h), when wilting after treatment (6 h after treatment), and after transfer to 1/2 Hoagland solution rehydration treatment (12 h after transfer). Error bars are standard errors of the mean from three biological replicates. The different letters indicate significant differences at p < 0.05 (student’s t-test).
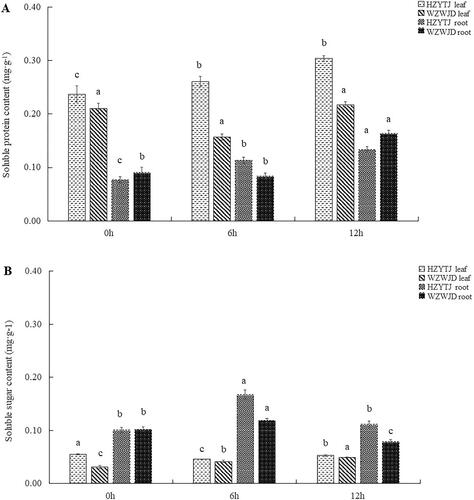
Figure 3. Changes in the proline contents (mg·g−1 fresh weight) (A) and MDA contents (Nmol·mg−1 fresh weight) (B) in leaves and roots of common bean varieties ‘WZWJD’ and ‘HZYTJ’ during 10% PEG-simulated drought stress and rewatering. Samples (leaves and roots) were collected at three time points, specifically, when untreated (0 h), when wilting after treatment (6 h after treatment), and after transfer to 1/2 Hoagland solution rehydration treatment (12 h after transfer). Error bars are standard errors of the mean from three biological replicates. The different letters indicate significant differences at p < 0.05 (student’s t-test).
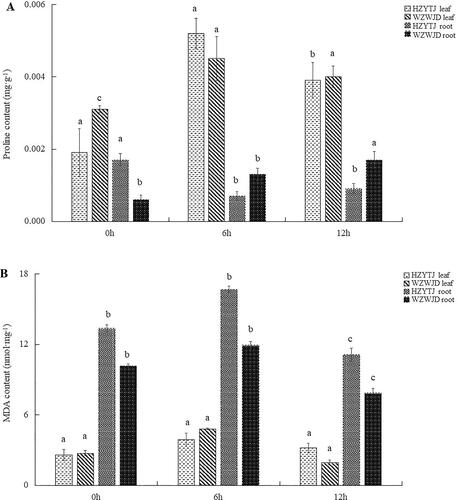
Figure 4. Correlation of RNA-seq data among different samples of common bean varieties ‘WZWJD’ and ‘HZYTJ’. Heatmap (A) of correlation coefficient values across samples based on RNA-seq FPKM. Cluster tree (B) based on the distances of expressed genes. CK11, CK12 and CK13 are the three biological replicates of ‘HZYTJ’ sampled at 0 h; T11, T12 and T13 at 6 h; T31, T32 and T33 at 12 h. CK21, CK22 and CK23 are the three biological replicates of ‘WZWJD’ sampled at 0 h; T21, T22 and T23 at 6 h; T41, T42 and T43 at 12 h. Samples (leaves and roots) were collected at three time points, specifically, when untreated (0 h), when wilting after treatment (6 h after treatment), and after transfer to 1/2 Hoagland solution rehydration treatment (12 h after transfer).
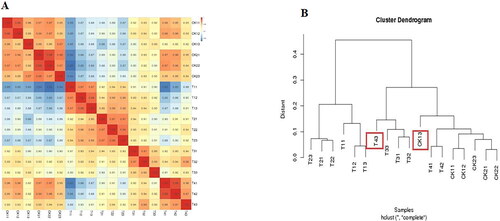
Figure 5. Heatmap analysis of DEGs. DEGs analysis of the ‘HZYTJ’ transcriptome (A) and ‘WZWJD’ transcriptome (B). The DEGs gene expression level is shown by the logarithmic normalized RNA-seq FPKM value.
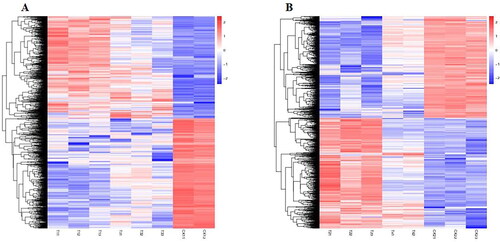
Figure 6. Six clusters of coexpressed genes and the K-means clustering pattern analysis of the DEGs. The gene expression level is shown by the logarithmic normalized RNA-seq FPKM value. The grey lines in the figure show the expression patterns of genes in each cluster, and the dark purple line represents the average expression of all genes in the cluster in the sample.
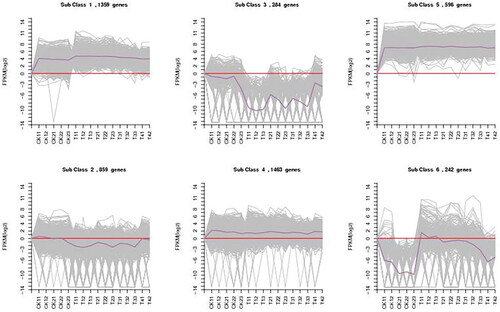
Table 1. Analysis of the main metabolic pathways of ‘HZYTJ’ under drought stress. The expression difference multiple log2 (fold change) ≥ 2, false discovery rate (FDR) <0.01, and p value <0.05 were used as screening criteria, and the DEGs genes were selected.
Table 2. Analysis of the main metabolic pathways of ‘WZWJD’ under drought stress. The expression difference multiple log2 (fold change) ≥ 2, false discovery rate (FDR) <0.01, and p value <0.05 were used as screening criteria, and the DEGs genes were selected.
Table 3. The KEGG enrichment of DEGs for qRT–PCR validation. The expression difference multiple log2 (foldchange) ≥ 2, false discovery rate (FDR) <0.01, and p value <0.05 were used as screening criteria.
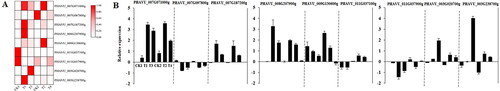
Figure 7. Relative expression levels of DEGs by RNA-seq (A) and qRT–PCR (B).
Supplemental Material
Download PDF (231.4 KB)Data availability statement
The raw RNA sequencing data to NCBI at (https://www.ncbi.nlm.nih.gov/bioproject/PRJNA946172) under accession numbers (SRX19727897-SRX19727914). All data that support the findings reported in this study are available from the corresponding author Meilan Li upon reasonable request ([email protected] or [email protected]).