
Figures & data
Table 1. Summary of the CiHSP genes in grass carp genome.
Figure 1. Phylogenetic analysis of the CiHSP genes in grass carp.
Note: Molecular phylogeny analysis of CiHSP genes was performed using MEGA11. Red circles represent subfamily HSP1; Light green squares represent subfamily HSP8; Blue triangles represent subfamily HSP5; Purple triangles represent subfamily HSP9; Pink diamonds represent subfamily HSP13; Brown green circles represent subfamily HSPh1; Yellow circles represent subfamily HSP4; Blackish green diamonds represent subfamily HSP14; Cyan hollow circles represent HSPhyou1; Deep blue hollow squares represent subfamily HSP12.
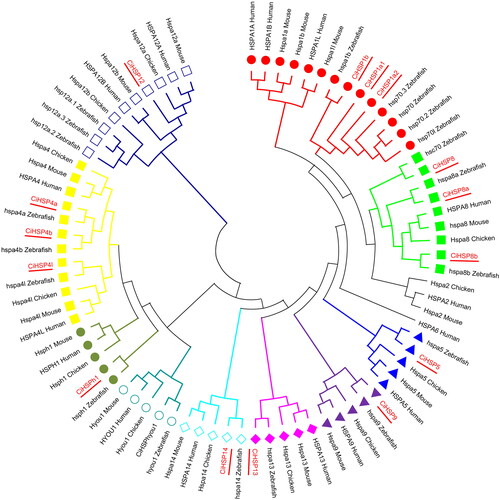
Figure 2. Distribution of conserved motifs in CiHSP genes.
Note: The conserved motifs in CiHSP genes were identified and characterized using MEME software. Each colored box represents the putative motifs detected in the protein sequence.
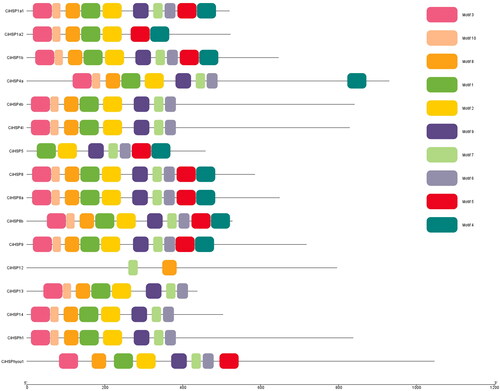
Figure 3. Chromosomal distribution and gene duplication analysis of the CiHSP genes in grass carp.
Note: All genes duplications were scanned and identified using MCSanX software, and they were displayed using CIRCOS software. All CiHSP genes were labeled with red short line, and genes with duplication event were linked with a black curve.

Figure 4. Gene regulatory network analysis of CiHSP genes in grass carp.
Note: Gene regulatory network of grass carp was reconstructed using zebrafish gene regulatory network (GRN) in STRING database. The pink nodes were CiHSP genes, and the light blue nodes were function genes interacting with CiHSP genes in grass carp.
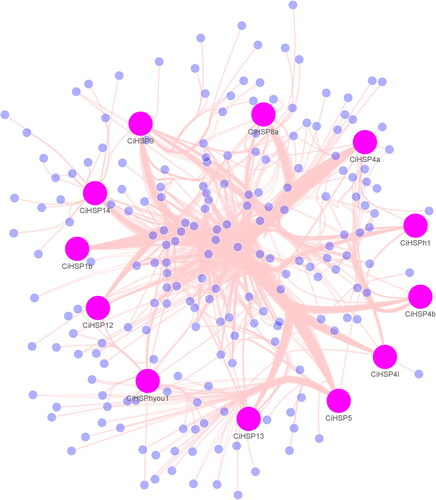
Figure 5. GO analysis of gene regulatory networks of CiHSP genes in grass carp.
Note: GO enrichment analysis was performed using topGO package. Red dot, BP (biological process); green dot, MF (molecular function), and blue dot, CC (cellular component) represent three types of GO terms. The dot size represents the number of genes enriched in the GO term. The ordinate is the term of GO, and the abscissa is the p-value of topGO enrichment analysis, −log10 (p).
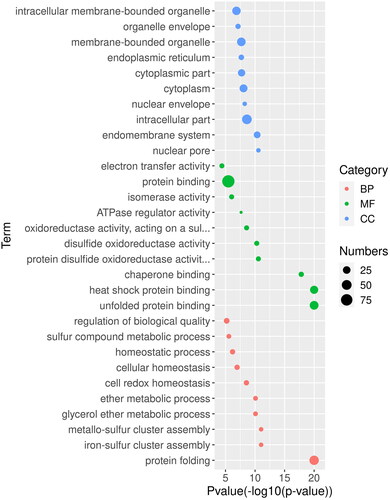
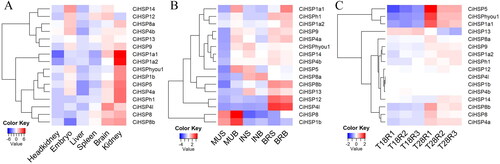
Figure 6. Expression profile of CiHSP genes in grass carp.
Note: The expression levels of CiHSP genes were downloaded from grass carp genome website and SRA database;, all expression data were clustered and plotted using the heatmap function in R platform. (A) Expression profile of CiHSP genes in six tissues; (B), expression profile of CiHSP genes response to high density stress; S group: Grass carp high-density culture (40 kg m−3); B group: normal culture (3 kg m−3); MUS represents muscle in S group, MUB represents muscle in B group; INS represents intestine in S group, INB represents intestine in B group; BRS represents brain in S group, BRB represents brain in B group; (C), expression profile of CiHSP genes response to high temperature stress; T18 represents lower temperature (18 °C) while T28 represents higher temperature (28 °C), R1-R3 represent replaces.
Supplemental Material
Download Zip (15.8 KB)Data availability statement
All data that support the findings reported in this study are available from the corresponding author upon reasonable request.