
Figures & data
Table 1. Demographic and clinical data of patients in both groups—with Nattokinase intake and control.
Figure 1. Time distribution (6- and 12-month period) of mean SBP and DBP (mmHg) in patients with acute cerebrovascular event and Nattokinase. W, women; M, men; TIA, transient ischemic attack; BL, baseline; SBP, systolic blood pressure; DBP, diastolic blood pressure. Data are mean values (n = 129) with standard deviation (SD).
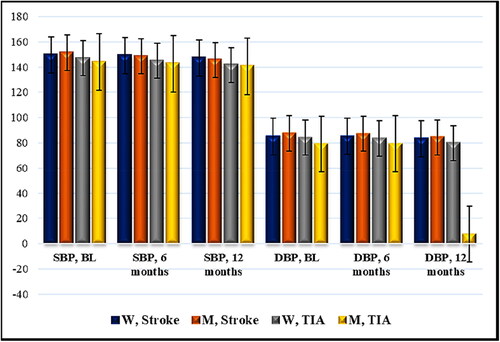
Figure 2. Time distribution (6- and 12-month period) of mean values of total and LDL cholesterol (Mmol/L) in patients with acute cerebrovascular event and Nattokinase. W, women; M, men; TIA, transient ischemic attack; BL, baseline; TC, total cholesterol; LDL-C, low-density lipoprotein cholesterol. Data are mean values (n = 129) with standard deviation (SD).
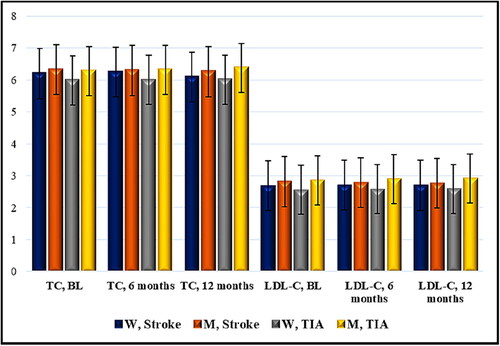
Figure 3. Time distribution (6- and 12-month period) of mean scores of MMSE (points) in patients with acute cerebrovascular event and Nattokinase. W, women; M, men; TIA, transient ischemic attack; BL, baseline; MMSE, Mini Mental State Examination. Data are mean values (n = 114) with standard deviation (SD).
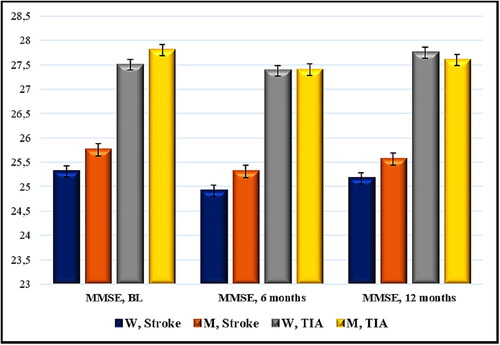
Figure 4. Time distribution (6- and 12-month period) of mean scores of MMSE and MoCA (points) in cases with TIA and Nattokinase. W, women; M, men; TIA, transient ischemic attack; BL, baseline; MMSE, Mini Mental State Examination; MoCA, Montreal Cognitive Assessment. Data are mean values (n = 13) with standard deviation (SD).
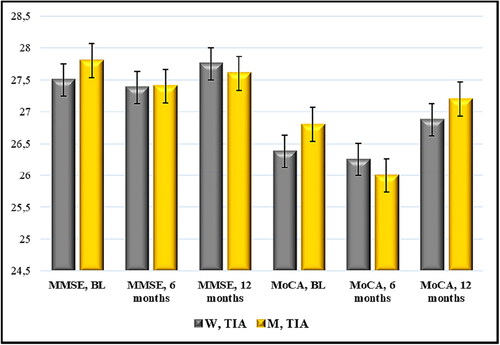
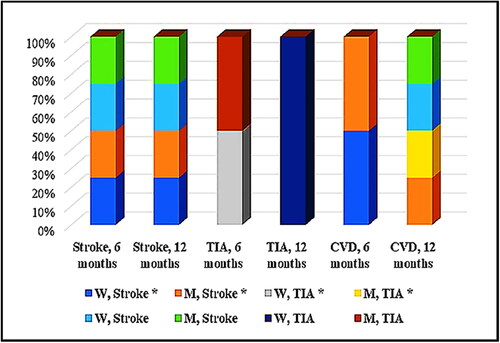
Figure 5. Distribution (by gender and time period) of vascular complications in both groups: with Nattokinase intake (*) and control. Data are mean values (Nattokinase group, n = 129 versus control group, n = 126) with standard deviation (SD).
Data availability statement
The data used for the analysis are available from the corresponding author (DM) upon reasonable request. The data are not publicly available due to privacy or ethical restrictions.