
Figures & data
Figure 1. IgM values in COVID-19 patients at different time points after disease onset.
(A) Mean IgM values at different time points in mild, moderate and severe illness groups given with standard deviation (±SD). Only statistically significant differences are presented (*p < .05, **p < .005).
(B) Percentages of positive, borderline and negative samples for IgM at different time points overall and in the mild, moderate and severe disease groups.
(C) Mean IgM values at different time points in vaccinated and unvaccinated patients given with standard of deviation (±SD). Statistically significant differences are shown (*p < .05, ***p < .0005; ns = not significant, p > .05).
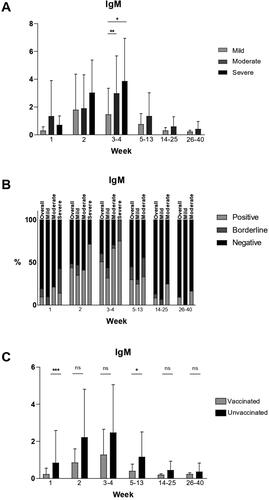
Figure 2. IgA values in COVID-19 patients at different time points after disease onset.
(A) Mean IgA values at different time points in mild, moderate and severe illness groups given with standard deviation (±SD). Only statistically significant differences are presented (*p < .05, **p < .005, ****p < .00001).
(B) Percentages of positive, borderline and negative samples for IgA at different time points overall and in the mild, moderate and severe disease groups.
(C) Mean IgA values at different time points in vaccinated and unvaccinated patients given with standard of deviation (±SD). Statistically significant differences are shown (**p < .005, ***p < .0005; ns = not significant, p > .05).
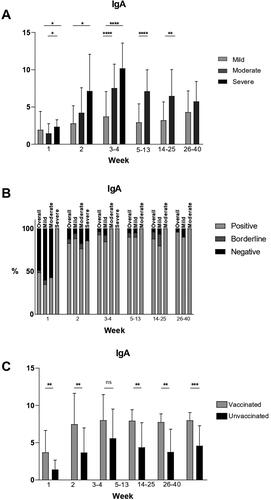
Figure 3. IgG values in COVID-19 patients at different time points after disease onset.
(A) Mean IgG values at different time points in mild, moderate and severe illness groups given with standard deviation (±SD). Only statistically significant differences are presented (*p < .05, **p < .005, ****p < .00001).
(B) Percentages of positive, borderline and negative samples for IgG at different time points overall and in the mild, moderate and severe disease groups.
(C) Mean IgG values at different time points in vaccinated and unvaccinated patients given with standard of deviation (±SD). Statistically significant differences are shown (***p < .0005, ****p < .00001; ns = not significant, p > .05).
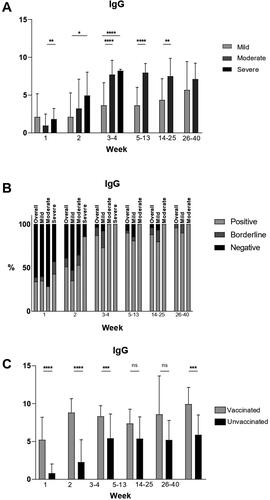
Figure 4. Individual values (left panels) and mean values (right panels) of SARS-CoV-2 viral load from nasopharyngeal swab specimens in patients with mild (A), moderate (B) and severe (C) COVID-19. SARS-CoV-2 viral load is determined at four time points: 0–7 days, 8–14 days, 15–21 days and 22–28 days after onset of symptoms. Statistical differences were determined by the Kruskal–Wallis test. Statically significant differences are shown (*p < .05, **p < .005, ***p < .0005, ****p < .00001; ns = not significant, p > .05).
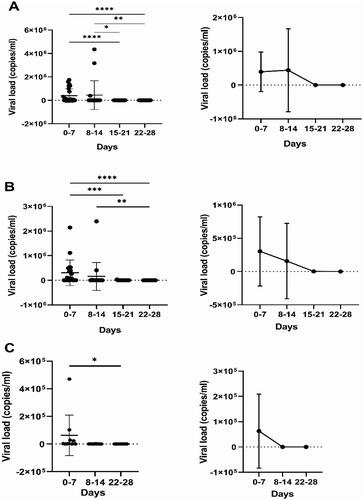
Figure 5. Comparison between SARS-CoV-2 viral loads during the first (A), second (B), third (C) and fourth (D) weeks with mean values ± SD (in copies/mL) from patients with mild, moderate and severe COVID-19 infection.
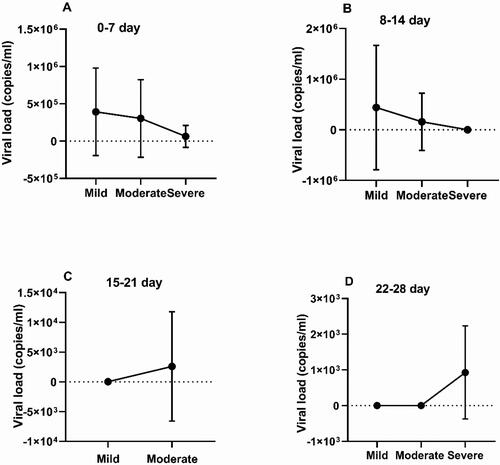
Table 1. Mean antibody levels and mean viral loads in the different disease severity groups at different time points.
Data availability statement
The anonymized data that support the findings of this study are available on request from the corresponding authors.