
Figures & data
Table 1. Baseline characteristics of the patients in the two groups.
Figure 1. Taxa relative abundance at the genus level. Y-axis represents ‘relative abundance’ and X-axis represents ‘samples name’ where ‘A’ are samples from non-pregnant women and ‘B’ are samples from women with subsequent pregnancy after FET. "others" represents the total relative abundance of the rest of the phyla besides the top 10 genera.
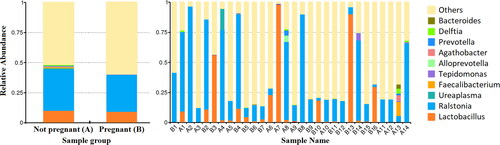
Figure 2. Bacterial taxa significantly associated with IVF outcome. Box plots showing taxa with significant difference in relative abundance between non-pregnant patients and those with subsequent pregnancy after FET.
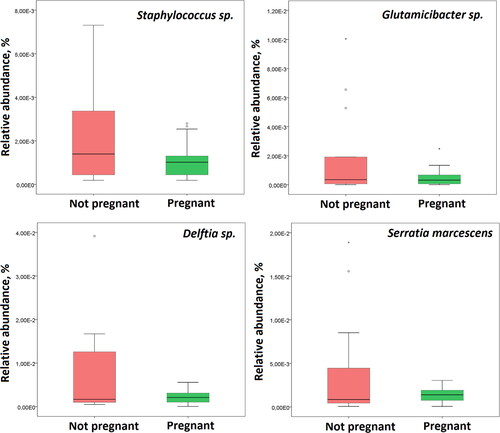
Figure 3. Taxonomic abundance cluster heatmap (plotted by sample name on the X-axis and the Y-axis represents the genus. The absolute value of ‘z’ represents the distance between the raw score and the mean of the standard deviation. ‘Z’ is negative when the raw score is below the mean, and vice versa. ‘A’ – samples from non-pregnant patients, ‘B’ – samples from pregnant patients (with subsequent pregnancy after FET).
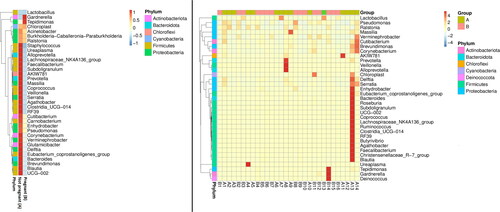
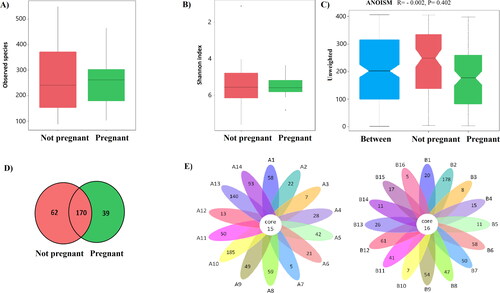
Figure 4. Differences in the defined taxa between endometrial samples from non-pregnant women and those who became pregnant after FET. (A) Box plots showing the observed number of species; (B) Box plots showing the Shannon indices (alpha diversity); (C) Box plots showing unweighted analyses of similarities (ANOSIM) (beta diversity) based on the distance matrix of UniFrac dissimilarity of the endometrial microbial communities in the pregnant and non-pregnant patients. Respective ANOSIM R values show the community variation between the groups and P values are indicated. The axes represent the two dimensions explaining the greatest proportion of variance in the communities; (D) Venn diagram – each circle represents one group – pregnant and non-pregnant women. Values in overlapping parts represent common species. The rest are species specific for each group. (E) Flower diagram based on operational taxonomic units (OTUs); notes: each petal in the flower diagram represents one sample, with different colours for different samples. The core number in the Centre is for the number of OTUs present in all samples, while the number in the petals is for the unique OTUs only showing in each sample. ‘A’ – samples from non-pregnant patients, ‘B’ – samples from patients who became pregnant after FET.
Data availability statement
The data that support the findings of this study are available on request from the corresponding author.