
Figures & data
Table 1. Pathological characteristics of the studied group of patients with bladder cancer. The table demonstrates clinical and epidemiological data of the studied patients as well as characteristics of the analyzed tumor samples.
Figure 1. Gene expression levels of the AP1S1, FIGF, CDK9 and HDAC11 genes among the uroepithelial samples studied. The average expression levels of the tested genes are shown. Dashed line marks cut-off value of 4-fold change in gene expression. ***P<0.0001 indicates a statistically significant difference between the AP1S1 and FIGF gene expression levels in comparison to the CDK9 gene. ^^P<0.001 and ^^^P<0.0001 indicate significant difference of AP1S1 and FIGF gene expression levels in comparison to the HDAC11 gene, respectively. "ns" indicates "non-significant" difference between CDK9 and HDAC11 gene expression levels.
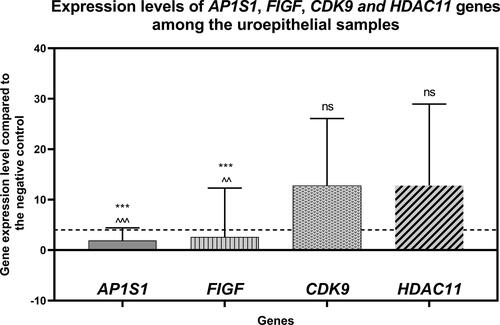
Table 2. Statistical data from the gene expression analysis. Descriptive statistics of the data from the gene expression results are shown: minimum, maximum and median values, range, mean, confidence interval (CI) and standard deviation (Std. Deviation) of the mean.
Figure 2. Expression levels of the AP1S1, FIGF, CDK9 and HDAC11 genes among the tested clinical groups in terms of tumor stage (Precancerous, pTa, рТ1, рТ2, pT2a and pT2b). The average expression levels of the tested genes are shown. Dashed line marks cut-off value of 4-fold change in gene expression. Error bars show standard deviation of the means. The distinct clinical groups are four groups of uroepithelial carcinoma: stage pTa, pT1, pT2, pT2a and T2b as well as a group of tumor lesions from a chronic inflammatory process (Precancerous lesion); ”*” indicates a P-value less than 0.05, “**” indicates a P-value less than 0.01 and “***”indicates a P-value less than 0.001 for one-sample Wilcoxon test.
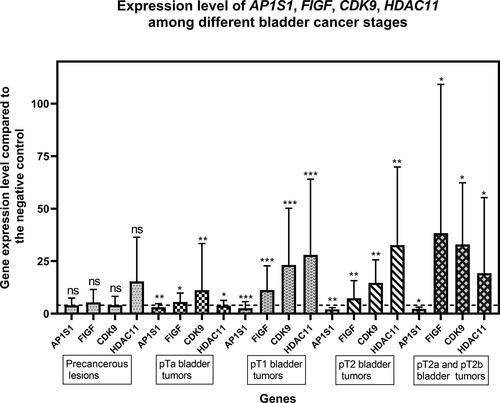
Figure 3. Expression levels of AP1S1, FIGF, CDK9 and HDAC11 genes among the tested clinical groups in terms of degree of invasion into the muscle layer. The average expressions of the tested genes are shown. Dashed line marks cutoff 4-fold change in gene expression. Error bars show standard deviation of the means. P value < 0.0001 found by Kruskall-Wallis statisticaltest .”*” indicates a P-value less than 0.05, “**” indicates a P-value less than 0.01 and “***”indicates a P-value less than 0.001 for one-sample Wilcoxon test, “ns” indicates nonsignificant.
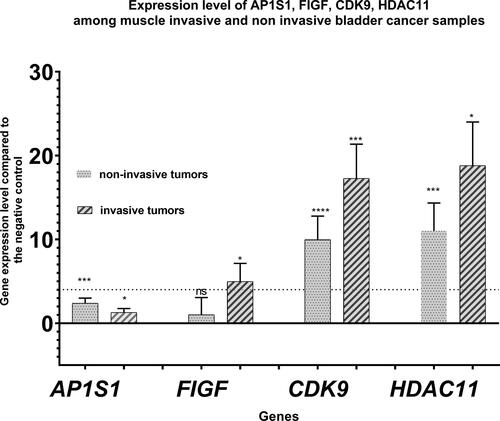
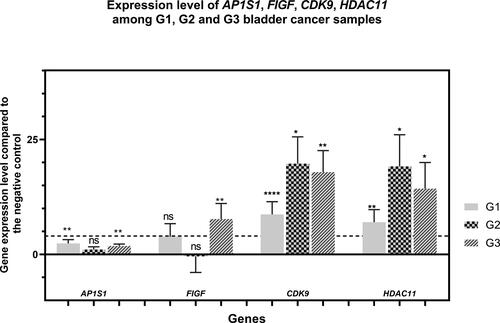
Figure 4. Expression levels of AP1S1, FIGF, CDK9 and HDAC11 genes among the tested clinical groups in terms of tumor grade. The average expression levels of the tested genes are shown in relation to the tumor grade. Dashed line marks cutoff 4-fold change in gene expression. Error bars show standard deviation of the means. The separate clinical groups are uroepithelial tumors with histological grade G1, G2 and G3 . P value < 0.0001 found by One-way ANOVA. . ”*” indicates a P-value less than 0.05, “**” indicates a P-value less than 0.01 “***”indicates a P-value less than 0.001, “***” indicates a P-value less than 0.0001 for one-sample Wilcoxon test, “ns” indicates nonsignificant.
Data availability statement
The data that support the findings of this study are available from the corresponding author, upon reasonable request.