
Figures & data
Table 1. Validated primers to amplify the complete mtDNA.
Table 2. Distribution of patients with LHON (n = 22) according to age of onset of first symptoms of the disease.
Table 3. Distribution of visual acuity in patients with LHON (n = 22).
Figure 1. Bilateral central scotomas in the visual field of a patient, 28 years old, with LHON.
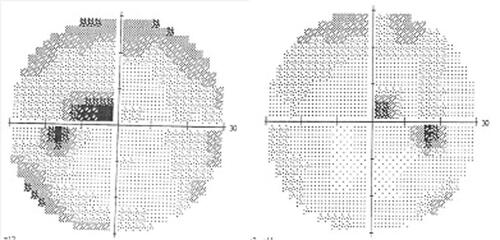
Figure 2. Photograph of the fundus of the eye of a patient, age 16 years, with LHON in the acute stage, showing mild hyperemia of the optic disc and tortuosity of the retinal vessels [Citation24].
![Figure 2. Photograph of the fundus of the eye of a patient, age 16 years, with LHON in the acute stage, showing mild hyperemia of the optic disc and tortuosity of the retinal vessels [Citation24].](/cms/asset/78c12d42-87c0-4ff3-bac6-f5dc95344ff4/tbeq_a_2255073_f0002_c.jpg)
Figure 3. Optical coherence tomography in a patient with LHON – data on manifest ‘thinning’ of the retinal neuro-fibre layer in both eyes.
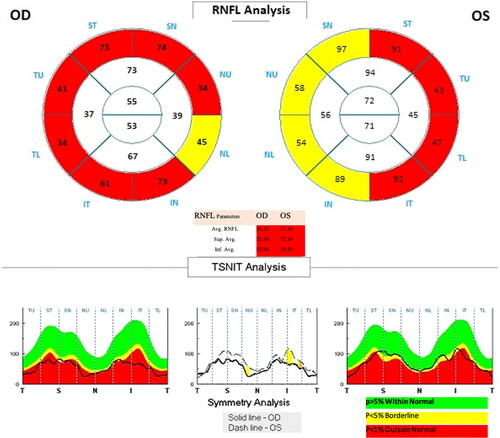
Table 4. Distribution of LHON patients (n = 22) according to the type of mutation causing the disease.
Figure 4. A family with LHON with five affected individuals (four of them previously reported [Citation24]) with the G3635A, p. S110N mutation in MT-ND1.
![Figure 4. A family with LHON with five affected individuals (four of them previously reported [Citation24]) with the G3635A, p. S110N mutation in MT-ND1.](/cms/asset/f908893d-aa73-49fc-973d-1bf1c3614e7b/tbeq_a_2255073_f0004_b.jpg)
Data availability statement
The anonymized data that support the findings of this study are available on request from the corresponding author [S.C.]. The data are not publicly available due to privacy or ethical restrictions.