
Figures & data
Figure 1. Area of mucositis on the right cheek of a rat.
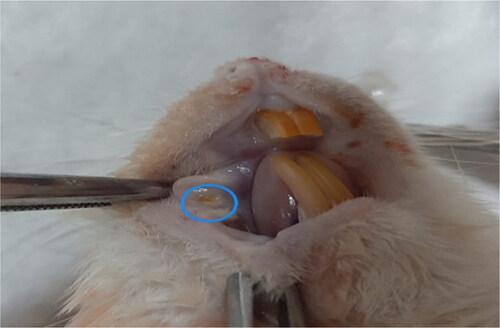
Figure 2. Histopathological analysis of the therapeutic effect of EA in rats with experimental oral mucositis. (a) Routine healing with serofibrinous exudation containing erythrocytes (arrows) and epithelial regeneration (arrowhead) at the incision line in the control group where only experimental oral mucositis was induced, Control Group, oral mucosa, Rat, HE, Scale bar = 100 µm. (b) Severe hemorrhagic and necrotic foci (thick arrow), bacterial colonies (stars), vascular hyperemia in the lamina propria (thin arrow) and inflammatory cell infiltration in the interstitial connective tissue at the infected wound site (arrowhead) in Group I rats with experimental oral mucositis after EA administration for the first 5 days. Group I, oral mucosa, Rat, Scale bar = 100 µm. (c) Bacterial colonies (asterisks) with mononuclear cell infiltration around the necrotic area (arrowheads) and hyperemia in the basal lamina propria (arrow) in Group II rats given EA for 5 days after experimental oral mucositis was induced. Group II, oral mucosa, Rat, HE, Scale bar = 100 µm.
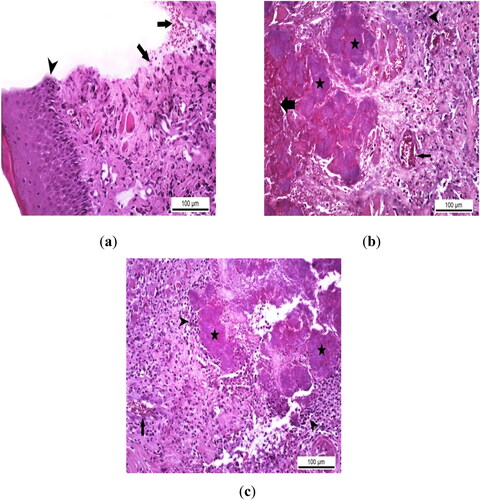
Figure 3. Immunohistochemical analysis of TNF alpha expression as an acute inflammation biomarker in rats with experimental oral mucositis and investigating the therapeutic effect of EA. (a) In the control group where experimental oral mucositis was induced, TNF alpha expression was not observed in the epithelial layer and lamina propria. Control Group, oral mucosa, Rat, IHC, Scale bar = 50 µm; (b) TNF alpha expression (marked by arrowheads) in the epithelial cells, lamina propria and intravascular inflammatory cells of rats in Group I, where experimental oral mucositis was induced after the first 5 days of EA administration. Group I, oral mucosa, Rat, IHC, Scale bar = 50 µm; (c) TNF alpha expression (marked by arrowheads) in the cytoplasm of inflammatory cells in the lamina propria of rats in Group II, who received EA for 5 days following the induction of experimental oral mucositis. Group II, oral mucosa, Rat, IHC, Scale bar = 50 µm.
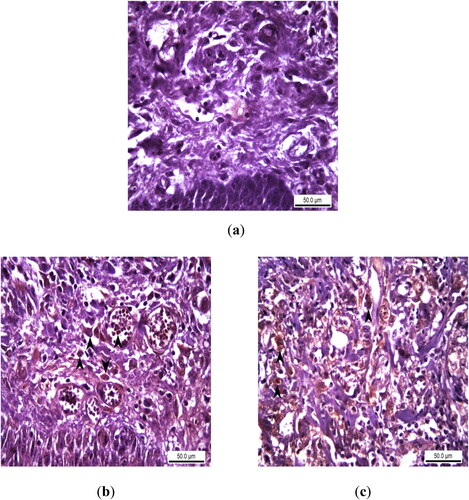
Figure 4. Immunohistochemical analysis of 8-OHdG expression as a DNA oxidation biomarker in rats with experimental oral mucositis investigating the therapeutic effect of EA. (a) In the control group where experimental oral mucositis was induced, 8-OHdG expression was not observed in the epithelial layer and lamina propria. Control Group, oral mucosa, Rat, IHC, Scale bar = 50 µm. (b) 8-OHdG expression (marked by arrowheads) in the nuclei of epithelial cells and inflammatory cells in the lamina propria of rats in Group I, where experimental oral mucositis was induced after the first 5 days of EA administration. Group I, oral mucosa, Rat, IHC, Scale bar = 50 µm. (c) 8-OHdG expression (marked by arrowheads) in the nuclei of epithelial cells of rats in Group II, who received EA for 5 days following the induction of experimental oral mucositis. Group II, oral mucosa, Rat, IHC, Scale bar = 50 µm.
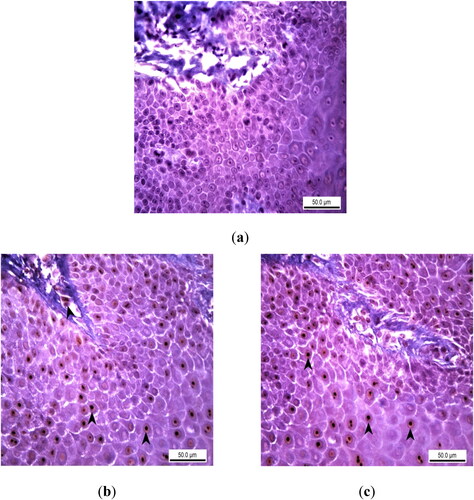
Table 1. Statistical analysis of histopathologic scores in the experimental groups.
Table 2. Scoring of immunohistochemical findings of acute inflammation biomarker TNF alpha expression and DNA damage biomarker 8-OHdG expression in the control and experimental groups.
Data availability statement
The data supporting the findings of this study are available from the corresponding author upon reasonable request.