
Figures & data
Table 1. Seropositivity levels of healthcare workers and the general population.
Figure 1. Comparison of IgA and IgG (anti-Spike protein and anti-Nucleoprotein) class antibodies in the general population and healthcare workers (HCWs) in February 2023. The statistical differences were determined by the Kruskal–Wallis test (**p < 0.005, ****p < 0.0001, ns = non-significant).
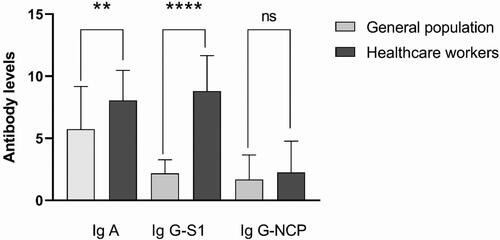
Figure 2. Comparison of IgA and IgG (anti-Spike protein and anti-Nucleoprotein) class antibodies in the general population in December 2021 and February 2023. The statistical differences were determined by the Kruskal–Wallis test (* p < 0.05, ** p < 0.005, ***p < 0.0005).
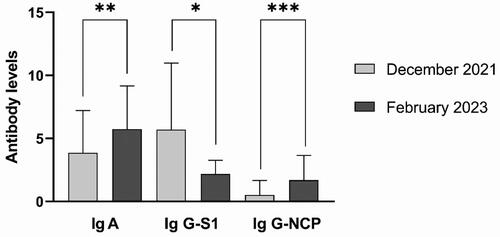
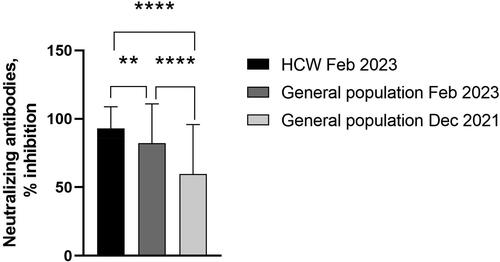
Figure 3. Comparison of neutralizing antibodies between the studied groups—the general population (December 2021 and February 2023) and healthcare workers (HCWs). The statistical differences were determined by the Kruskal–Wallis test (**p < 0.005, ****p < 0.0001).
Data availability statement
The data that support the findings of this study are available on request from the corresponding authors.