
Figures & data
Table 1. Demographic and clinical characteristics of the study groups.
Figure 1. Comparison of sRAGE (A), sRANKL (B) and OPG (C) in subgroups of RA patients according to the level of CRP (CRP ≤ 8 and CRP > 8).
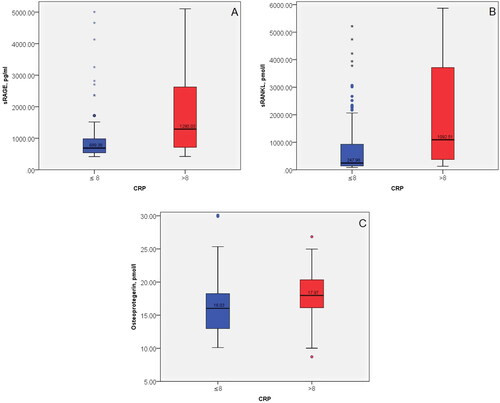
Table 2. Correlations of sRAGE in subgroups of RA patients according to the level of CRP (CRP ≤ 8 and CRP > 8).
Table 3. Correlations of sRANKL in subgroups of RA patients according to the level of CRP (CRP ≤ 8 and CRP >8).
Table 4. Correlations of OPG in subgroups of RA patients according to the level of CRP (CRP ≤ 8 and CRP > 8).
Data availability statement
The data that support the findings of this study are available on request from the corresponding author, GD. The data are not publicly available due to their containing information that could compromise the privacy of research participants.