
Figures & data
Table 1. Demographic, clinical, and histological parameters of the patients with colorectal cancers included in this study.
Table 2. Antibodies used for IHC analyses, the applied dilutions and the company producers.
Table 3. Distribution of the DCs labeled immunohistochemically for CD1a, CD83, CD11c, and CD123 cell markers in tumor stroma (TS) and invasive front (IF) of biopsies of primary CRCs.
Table 4. Correlations between the density of DCs expressing the studied markers, as well as of DCs with IL-6+ or CD8+ cells in tumor stroma (TS) and invasive front (IF) of biopsies of primary CRCs.
Figure 1. Immunohistochemically labeled DCs in CRC biopsies: CD1a + DCs (200x magnification) (a); CD83+ DCs (200x magnification) (b); CD123+ DCs in CRC (100x magnification) (c); CD11c+ DCs in CRC (100x magnification) (d) (IF: invasive front; TS- Tumor stroma); scale bars = 100 µm (a, c); 200 µm (b, d).
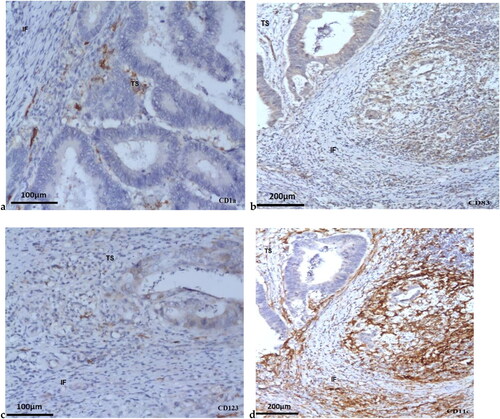
Figure 2. Density (cells/mm2) of the CD1a+, CD83+, CD123+, and CD11c+ DCs determined by IHC in tumor biopsies form patients with MSI and MSS CRC. Data are presented as means ± SEM, and the differences between the mean ranks were assessed by Mann-Whitney U test.
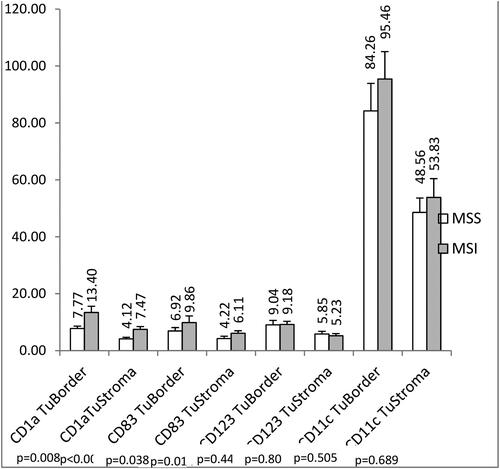
Figure 3. Density (cells/mm2) of the CD1a+ DCs determined by IHC in tumor biopsies between CRC patients with early pTNM stage (II stage) and with advanced pTNM stages (III/IV stage). Data are presented as means ± SEM, and the differences between the mean ranks were assessed by Mann-Whitney U test.
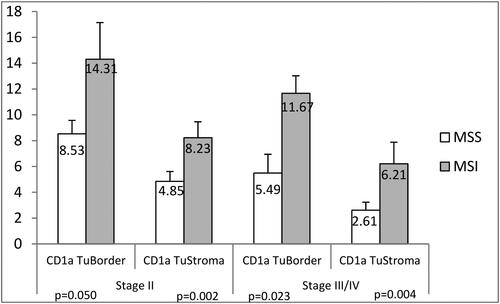
Figure 4. Kaplan-Meier survival curve of the patients with CRCs according to the MSI/MSS status of the cancers. The significance of the difference is assessed with Log-rank test. p = 0.426.
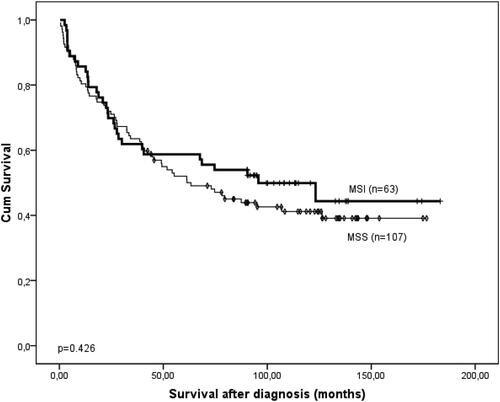
Table 5. Single factorial (univariate) and multifactoral (multivariate) Cox proportional analysis of the survival of patients with CRC.
Figure 5. Kaplan-Meier survival curve of the patients with CRCs according to the density (cells/mm2) of CD1a+ (A and B) and CD83+ DCs (C and D) in the TS (A and C) and tumor border, IF (B and D). The significance of the difference is assessed with Log-rank test (A: p = 0.017; B: p = 0.042; C: p = 0.033; D: p = 0.002).
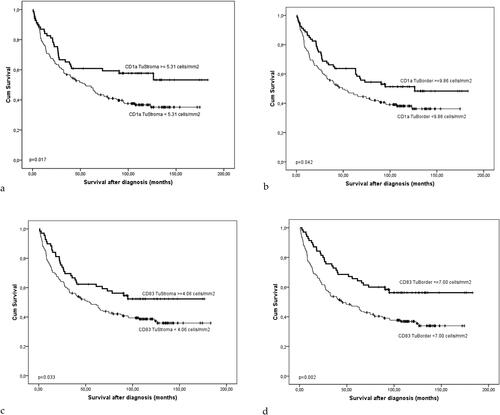
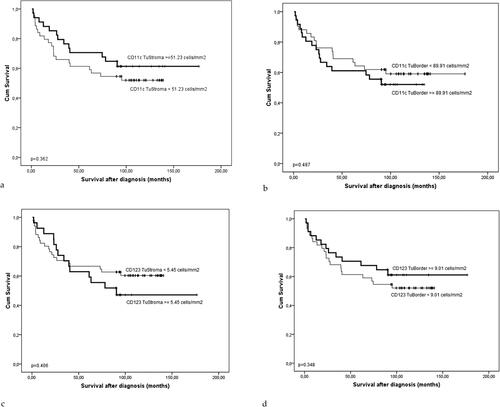
Figure 6. The Kaplan-Meier survival curve of the patients with CRCs according to the density (cells/mm2) of CD11c+ (a and B) and CD123+ DCs (C and D) in the TS (a and C) and tumor border, IF (B and D). The significance of the difference is assessed with Log-rank test (A: p = 0.362; B: p = 0.487; C: p = 0.406; D: p = 0.348).
Data availability statement
The raw data are available from the corresponding authors upon reasonable request.