
Figures & data
Table 1. Primers used for qRT-PCR in the present study.
Figure 1. Expression level of GhSWEET42 in bract, petal and developing ovules and fibres. We sampled bract and petal on 0 DPA; 10, 15 and 20 DPA-F are fibre samples; 0, 1 and 3 DPA-O are fibre-bearing ovules; 10, 15 and 20 DPA-O are ovules samples. GhHIS3 was the internal control. Data are means ± SD (n = 3). Different letters indicate statistically different groups (p < 0.05; ANOVA with Tukey’s multiple comparison test).
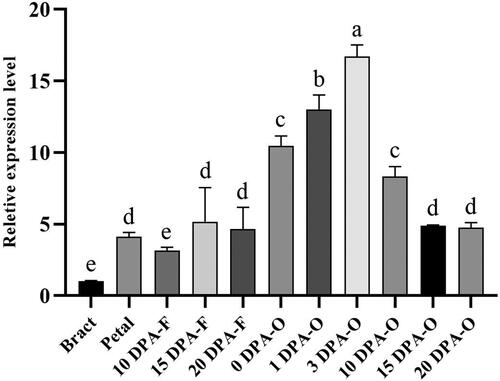
Figure 2. Level of GhSWEET42 transcript in developing siliques at 7–10 DPA in WT and transgenic Arabidopsis overexpression lines. (A) RT-PCR analysis. (B) Relative GhSWEET42 expression in the transgenic Arabidopsis lines OE-1, OE-2 and OE-3. AtUBQ10 was the internal control. Data are means ± SD (n = 3). Different letters indicate statistically different groups (p < 0.05; ANOVA with Tukey’s multiple comparison test).
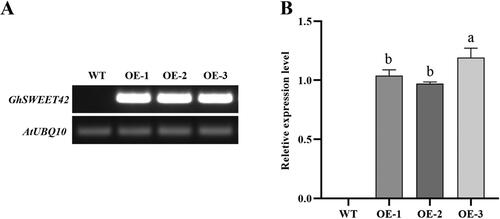
Figure 3. Seed oil content and fatty acid composition of GhSWEET42 transgenic Arabidopsis lines. (A) FA content in the seeds of WT and transgenic lines. (B,C) FA composition (g/100 g) of WT and transgenic seeds. Error bars indicate the standard error (±SE) of three independent biological replicates. Different letters indicate statistically different groups (p < 0.05; ANOVA with Tukey’s multiple comparison test). The values shown above the columns are the FA content of the seeds of the transgenic lines and are relative to that of the WT seeds (100%).
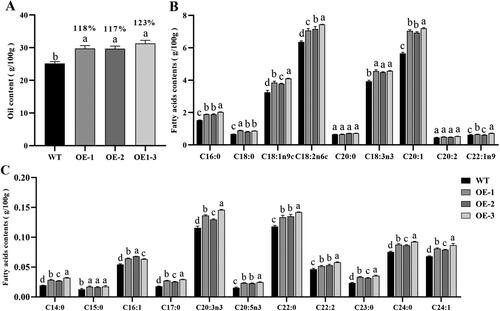
Figure 4. Sizes of seeds of GhSWEET42 transgenic lines. (A) Mature WT, OE-1, OE-2 and OE-3 seeds; bar = 500 μm. (B) Seed weight. (C) Relative seed length. (D) Relative seed width. Error bars indicate the standard error (±SE) of three independent biological replicates. Different letters indicate statistically different groups (p < 0.05; ANOVA with Tukey’s multiple comparison test). The values shown above the columns are the seed sizes of the transgenic lines and are relative to that of the WT seeds (100%).
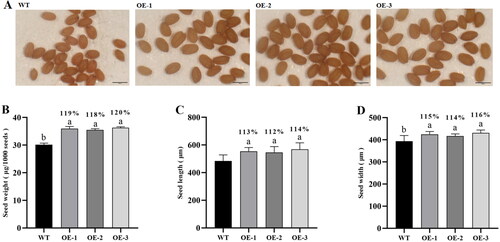
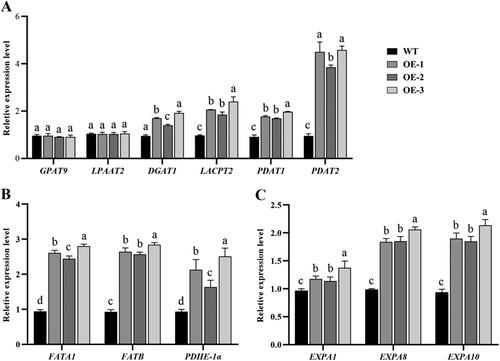
Figure 5. qRT-PCR analysis of GhSWEET expression in transgenic lines. The samples used were siliques developed with 7–10 DPA in WT and transgenic Arabidopsis overexpression lines. (A) Expression levels of TAG biosynthesis-related genes. (B) Expression levels of FA biosynthesis-related genes. (C) Expression levels of cell expansion-related genes. AtUBQ10 was the internal control. Different letters indicate statistically different groups (p < 0.05; ANOVA with Tukey’s multiple comparison test).
Supplemental Material
Download PDF (805.1 KB)Data availability statement
All raw data will be made available by the corresponding authors [Y.S. and S.G.] without undue reservation and upon reasonable written request.