Figures & data
Figure 1. MAPK1 silencing in adult 15 P-1 Sertoli cells suggests that MAPK1 Potentiates the NF-κB pathway and caspase-1 activation, either with TLR4 challenge alone or combined with NOD1. (a) Combined TLR4 challenge using 24 h LPS treatment with NOD1 challenge using simultaneous iE-DAP treatment, followed by 1 h of ATP treatment induced mature IL-1β secretion. (b) Specific caspase-1 activation is observed 24 h after TLR4 & NOD1 ligand challenge (LPS, iE-DAP), followed by 1 h of ATP supplementation, or after 48 h of MAPK1 silencing (siMAPK1). (c) NFκB activation is assessed after 48 h of MAPK1 silencing (siMAPK1) alone or followed by a TLR4 challenge for 24 h, using the stable 15 P-1 adult Sertoli cell line harbouring the pNIFTY2-SEAP reporter, which is sensitive to NFκB translocation. The secretory alkaline phosphatase released upon binding to the NFκB response element cassette, is measured in cell media as a colour reading at 405 nm. Error bars indicate SEM. Data are representative of independent experiments with three technical replicates using the adult Sertoli cell line 15 P-1. Asterisks above bars denote statistical significance as determined by ANOVA (* p < 0.05).
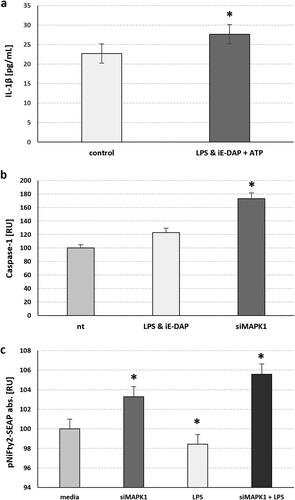
Figure 2. In vitro wound healing assay suggests complex interactions between MAPK1 and TLR4 pathways, where TLR4 plays a protective role in MAPK1 absence. (a) Representative bright-field images of Sertoli cell line 15 P-1 after forming confluent monolayer was scratched across and the migration front was assessed at 0, 6 and 24 h. (b) The rate of cell migration RM [µm/h] is expressed as RM = (Wi-Wf)/t, where Wi is the initial wound width [µm], Wf is the final wound width [µm] and t is the duration of migration [hours]. RM was plotted vs. time for intact (control) (black line), siMAPK1 transfected (48 h) (red line), TLR4 challenged with LPS (24 h)(blue, interrupted line) and siMAPK1 transfected and then LPS challenged 15 P-1 cells (red, interrupted line). Error bars indicate SEM. Data are representative of independent experiments with three technical replicates using the adult Sertoli cell line 15 P-1.
![Figure 2. In vitro wound healing assay suggests complex interactions between MAPK1 and TLR4 pathways, where TLR4 plays a protective role in MAPK1 absence. (a) Representative bright-field images of Sertoli cell line 15 P-1 after forming confluent monolayer was scratched across and the migration front was assessed at 0, 6 and 24 h. (b) The rate of cell migration RM [µm/h] is expressed as RM = (Wi-Wf)/t, where Wi is the initial wound width [µm], Wf is the final wound width [µm] and t is the duration of migration [hours]. RM was plotted vs. time for intact (control) (black line), siMAPK1 transfected (48 h) (red line), TLR4 challenged with LPS (24 h)(blue, interrupted line) and siMAPK1 transfected and then LPS challenged 15 P-1 cells (red, interrupted line). Error bars indicate SEM. Data are representative of independent experiments with three technical replicates using the adult Sertoli cell line 15 P-1.](/cms/asset/3f9dbf16-1d6e-4873-83d6-865419391c18/tbeq_a_2268749_f0002_c.jpg)
Figure 3. TLR4 challenge Favoured macroautophagy for mitophagy and this was more pronounced in starvation conditions. Sertoli cell line 15 P-1 was subjected to 24 h LPS challenge compared to non-treated controls in high glucose and low glucose conditions, with or without prior treatment with Bafilomycin A1 for 2 h. (a) The DOJINDO fluorescent dye DAPGreen was used to monitor the autophagosome initiation and formation, as well as its fusion with lysosomes, as its fluorescence depended on its incorporation into double hydrophobic autophagosome membrane. DOJINDO MtPhagy fluorescent dye was used to monitor specific mitophagy, as its fluorescence depended on environment pH during autolysosome formation and dye transformation within mitochondrial membranes. Representative figures of DAPGreen and MtPhagy treated control and LPS challenged cells in high/low glucose conditions with or without Bafilomycin A1 pretreatment are shown. Each panel consists of brightfield image (grey), DAPI nuclear staining (blue), DAPGreen autophagosome staining (green), MtPhagy mitophagy staining (red). arrowheads show regions with autophagosome formation or mitophagy, accordingly. (b) Each condition was analysed by estimating semiquantitative score (0, no staining; 1-3 levels of staining) for at least three fields of view. Error bars indicate SEM. Data are representative of independent experiments with three technical replicates using the adult Sertoli cell line 15 P-1. Asterisks above bars denote statistically significant differences as determined by non-parametric Kruskal-Wallis H test (*, **, *** p < 0.05). Each pairwise comparison is denoted by same the number of asterisks.
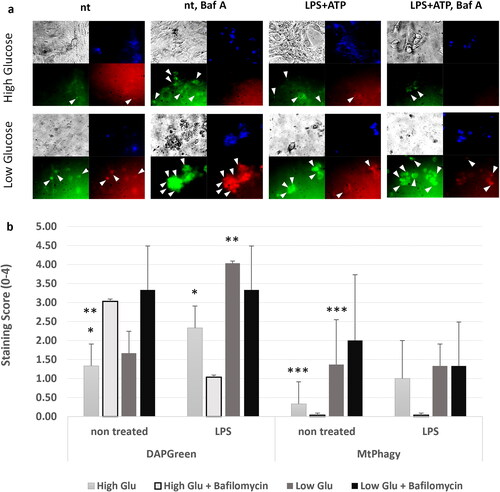
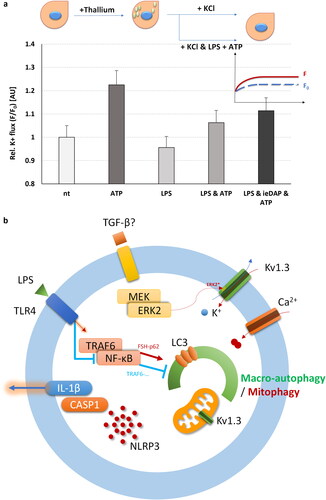
Figure 4. FluxORTM assessment of TLR4 and NOD1 challenge alone or in combination with ATP supplementation on voltage gated potassium channels (such as Kv1.3) in adult Sertoli 15 P-1 cells. (a) Relative potassium ion (K+) flux assessed as F0/F ratio at 120 s in the following conditions: non-treated; ATP treated (1 h); TLR4 challenged for 24 h (LPS); TLR4 challenged for 24 h (LPS) and ATP treated for 1 h; co-challenged TLR4 and NOD1 for 24 h (LPS, iE-DAP) and ATP treated for 1 h. Error bars indicate SEM. Data are representative of independent experiments with three technical replicates using the adult Sertoli cell line 15 P-1. Inlet: FluxORTM experimental setting. K2SO4 is added to stimulus buffer to promote opening of voltage-gated K + channels. Baseline F0 values and F values were recorded for 120 s, and the F/F0 ratio was calculated, thus averaging, and normalising the flux towards treatment. (b) Schematic representation of the interaction between MAPK1/ERK2, TLR4.NF-κB, Kv1.3 channels, autophagy and NLRP3-CASP1-IL1β.