
Figures & data
Figure 1. Bacterial flora of rice koji collected from several breweries.
Notes: Letters (SA to SC) indicate the company and the numbers (1 to 4) indicate the sample number. Results for chloroplasts and mitochondria in rice koji were excluded. In samples SA-1 to SC-1, Staphylococcaceae spp. were predominant.
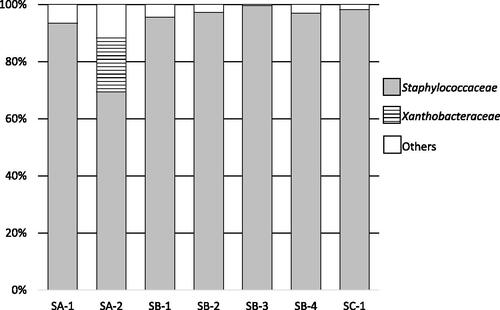
Figure 2. Bacterial flora of rice koji collected from several breweries at the genus level.
Notes: Letters (SA to SD) indicate the company and the numbers (1 to 4) indicate the sample number. Results for chloroplasts and mitochondria in rice koji were excluded. In samples SA-1 to SC-1, Staphylococcus were predominant.
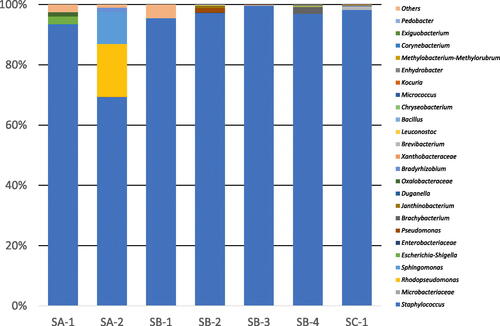
Figure 3. Changes in microbial profile during the five-stage koji production process for sample SA-1 from brewery A (a) and sample SB-3 from brewery B (b). an example of diagram for the mode of sake production process (rice koji production process and fermentation process) time-temperature (c).
Notes: Samples were collected at the end of each stage (Tokomomi, Kirikaeshi, Mori, Shimai-Shigoto, Dekoji) and the time was counted from the end of Tokomomi. Supplemental Figure S1 for a description of the stages. Filled triangles indicate the bacteria that were visually identified on standard assay agar. Filled circles indicate Aspergillus oryzae and filled squares indicate yeast; both were visually identified on potato dextrose agar (PDA). Colony-forming units (CFU) are presented as means of five replicate plates and standard deviations are shown as error bars. The vertical axis in (a) and (b) shows CFU in logarithmic scale. The data shown in (c) were taken from Tables S2 and S3, which were based on representative data.
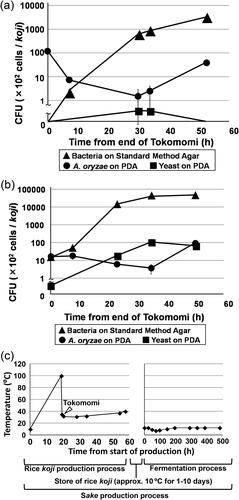
Table 1. Identification of bacterial isolates based on 16S rRNA gene sequences from each rice koji processing stage.
Figure 4. Changes in microbial counts of Staphylococcus gallinarum isolates and control strains in pregelatinized rice medium at 38 °C.
Notes: Isolates A1 (closed circle) and A2 (open circle) were obtained from brewery A, and isolates B1 (closed triangle) and B2 (open triangle) were obtained from brewery B. These isolates were already identified as S. gallinarum by 16S rRNA gene sequencing. Strains Bacillus subtilis JCM 1465T (closed rhombus) and S. aureus JCM 20624T were used as controls. Colony-forming units (CFU) are presented as means of five replicate plates, and standard deviations are shown as error bars.
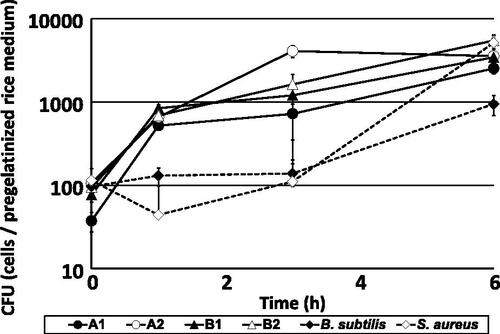
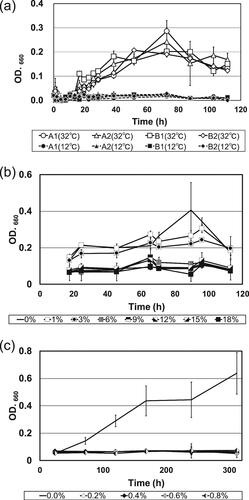
Figure 5. Growth curves of Staphylococcus gallinarum isolates in koji extract cultured at different temperatures, alcohol concentrations and lactic acid concentrations.
Notes: (a) Growth curves of S. gallinarum isolates cultured in koji extract medium at 12 °C and 32 °C, respectively. Strains A1 and A2 were obtained from brewery A, and strains B1 and B2 were obtained from brewery B. All data are presented as means of three replicate tubes, and standard deviations are shown as error bars. (b) Growth curves of S. gallinarum strain A2 cultured in koji extract medium containing various ethanol concentrations (0–18%, v/v). All data are presented as means of three replicate tubes, and standard deviations are shown as error bars. (c) Growth curves of S. gallinarum strain A2 cultured in koji extract medium containing various lactic acid concentrations (0–0.8%, w/v). All data are presented as means of three replicate tubes, and standard deviations are shown as error bars. OD: optical density.
Supplemental Material
Download PDF (955.4 KB)Data availability statements
All data that support the findings from this study are available from the corresponding author [K.N.] upon reasonable request.