
Figures & data
Figure 1. DES model representation. Blue rectangles are events that may happen during the lifetime of a patient, each updating quality of life and costs; some events are short-lasting, so they update costs and effects only during the time increment of one month, and some are long-lasting, updating costs and effects on quality of life until the end of a patient’s life. The arrows show the direction of movement of a patient during one model increment. After the pre-defined number of one-month model increments (n = 720), the model stops, total costs and effects are calculated for the current patient, and then another virtual patient enters.
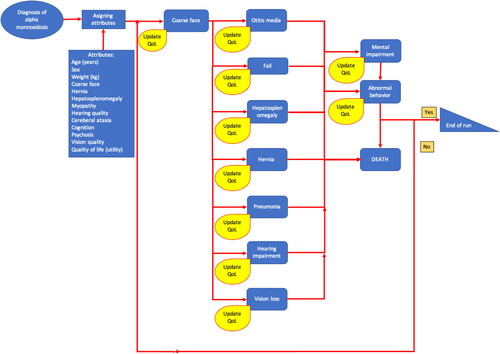
Table 1. Model inputs for events onset.
Table 2. Quality-of-life decrements and costs per episode and sustained.
Figure 2. ICER for three scenarios. Incremental cost-effectiveness planes for the three scenarios: velmanase alfa vs. no causal therapy, velmanase alfa vs. bone marrow transplantation (BMT), and BMT vs. no causal therapy. Each dot on the graphs is one virtual patient (n = 1000 virtual patients); λ1, λ2, and λ3 are cost-effectiveness thresholds of 1 Gross domestic Product (GDP) per capita per quality adjusted life year (QALY) gained, 3 GDPs per capita per QALY gained and 9 GDPs per capita per QALY gained, respectively. X-axis: difference in effects in QALYs (dE); Y-axis: difference in costs (dT).
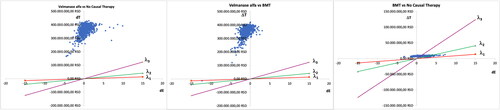
Figure 3. ICER CI for three scenarios. Incremental cost-effectiveness planes for the three scenarios: velmanase alfa vs. no causal therapy, velmanase alfa vs. bone marrow transplantation (BMT), and BMT vs. no causal therapy. Blue dots on the graphs within the blue squares represent incremental cost-effectiveness ratio (ICER) with its 99% confidence intervals (CIs); λ1, λ2, and λ3 are cost-effectiveness thresholds of 1 Gross domestic Product (GDP) per capita per quality adjusted life year (QALY) gained, 3 GDPs per capita per QALY gained and 9 GDPs per capita per QALY gained, respectively. X-axis: difference in effects in QALYs (dE); Y-axis: difference in costs (dT).
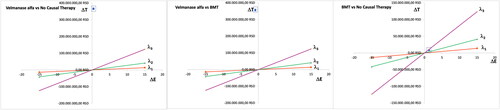
Figure 4. Tornado diagram for three scenarios. One-way sensitivity analysis for the three scenarios: velmanase alfa vs. no causal therapy, velmanase alfa vs. bone marrow transplantation (BMT), and BMT vs. no causal therapy. X-axis: net monetary benefit (NMB) if the first therapeutic option is used instead of the comparator. Blue bars on the graphs represent the variation range of the NMB if input parameters (shown on the right of the respective bars) are decreased and increased by 50%.
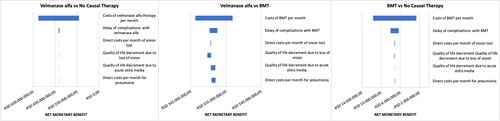
Table 3. Value of main output variables in the base case and PSA (mean ± 99%CI).
Supplemental Material
Download PDF (684.7 KB)Data availability statement
The study plan is available at the link: https://osf.io/gs756/. The models used in the study and other materials not contained in the Supplementary File are available to interested readers from the corresponding author, at reasonable request.