
Figures & data
Figure 1. Overall characterization of the core blood microbiome abundance (mean ± SEM) at two levels: (A) abundance difference in sarcoidosis and control groups plotted on a decimal logarithmic scale. (B) Top 4 phyla and (C) top 10 genera. (D) Average divergence between the sarcoidosis and control groups according to individual taxon abundance at phylum and (E) genus level. Asterisks indicate significant differences (Kruskal-Wallis group statistics) as follows: ***p < 0.001; **p < 0.01; *p < 0.05; ns – not significant; SEM – standard error of the mean.
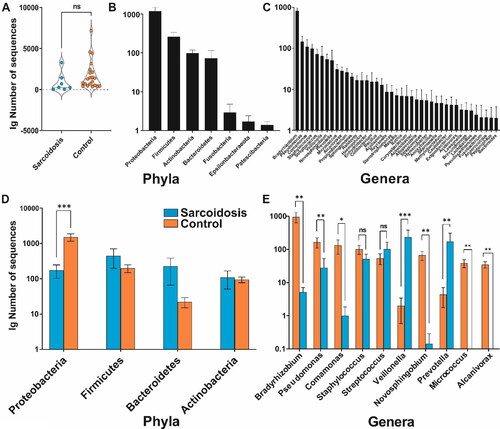
Table 1. Confusion matrix for assessing binary classification model.
Table 2. Shapiro–wilk test of normality for the distribution of the OTU reads for sarcoidosis and control group at phylum and genus level.
Table 3. Descriptive statistics of sarcoidosis vs. control group at phylum level. Mean ± SD along with the Kruskal–Wallis group statistics results.
Table 4. Descriptive statistics of sarcoidosis vs. control group at genus level abundance (mean ± SD) along with the Kruskal–Wallis group statistics results.
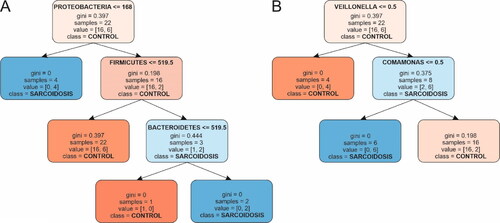
Figure 2. Decision tree diagrams. The control group is marked in orange; the sarcoidosis group is in blue. (A) Phylum; (B) Genus. Boxes represent nodes of classification with bifurcation. All nodes contain information about the classification process: threshold, number of samples, impurity coefficient and proportion of correctly vs. falsely classified samples. Bifurcation or splitting of the classification is shown with arrows. Nodes that did not bifurcate contained samples from only one class. The intensity of the color shade of each node indicates higher confidence in classification.
Data availability statement
The data that support the findings of this study are available from the author (YH), upon reasonable request.