
Figures & data
Figure 1. Mapping of L/LA-QTL and allele configuration of loci in the L/LA-QTL region in the recombinant plants. (a) LOD profile and molecular marker locations in the L/LA-QTL region on LG8 (the results of QTL analysis for all LGs of the L. angustifolia genome are presented in Supporting Information S1); (b) genotypes of plants according to the alleles of SSR, SRAP and ATT4 loci located in the L/LA-QTL region. The plant names correspond to the names of groups of plants from the segregating population which are presented in . The low/high value of the L/LA ratio is indicated for each plant genotype.
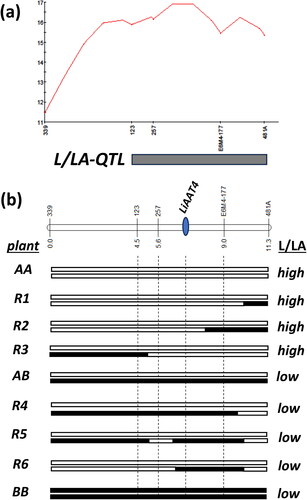
Figure 2. Box and whiskers plot showing the distribution of data for the L/LA ratio among groups of plants with different zygosity state for the L/LA-QTL region.
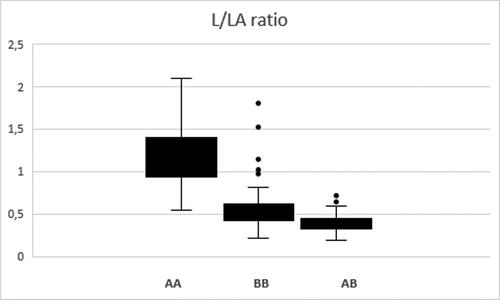
Table 1. Allele configurations of loci located in the identified L/LA-QTL region, L/LA ratio, relative contents of linalool (L) and linalyl acetate (LA) and total relative content of the sum of linalool and linalyl acetate (L + LA). The names of groups of plants with the same genotypes for the analyzed loci in the L/LA-QTL region are shown in bold.
Supplemental Material
Download Zip (3.4 MB)Data availability statement
All data included in this study are available from the corresponding author [I.A.] upon request.